Sprint Carryover: Why Your Teams Keep Missing Commitments and Roadmaps Slip
Chronic sprint carryover quietly turns every enterprise roadmap date into a guess. Discover what engineering leaders on Reddit say about the say/do gap, why velocity charts hide it, and how Keypup MCP measures carryover across Jira sprints and linked pull requests to show where commitments break, why, and which teams need help first.
TL;DR: In most enterprise engineering organizations, a third or more of the story points committed to each sprint roll into the next one unfinished. That carryover rarely shows up as a problem: velocity charts only count what closed, the burndown resets every two weeks, and the unfinished work quietly reappears in the next sprint plan. Over a quarter, it compounds into slipped roadmap dates nobody can explain. The Keypup MCP Server reads the sprints each Jira issue has passed through, its story points, its workflow status and the state of its linked pull requests, so your AI assistant can measure your real say/do ratio, show whether it is improving or eroding, separate "not started" from "merged but the ticket never moved," and point to the oversized, chronically carried issues that make roadmap dates fiction.
Ask an engineering director how a team's sprints are going, and you'll usually hear the velocity number. Ask how many of the points that team planned actually finished inside the sprint they were planned for, and the room goes quiet. In most enterprises, nobody tracks it — and that unmeasured gap between what teams say they'll do and what they do is where quarterly roadmaps go to die.
The Friction: Unfinished Work That Never Counts as a Miss
Sprint carryover — also called spillover or rollover — is the work planned into a sprint that is still open when the sprint closes and gets moved into the next one. A little is normal. Chronic carryover is not, and it hides remarkably well.
Velocity only counts what closed. A team that plans 400 points and closes 260 reports a velocity of 260. The 140 points that slipped don't appear on any chart — they just show up again, unannounced, in the next sprint plan.
Jira moves the work forward with one click. When a sprint closes, open issues get moved to the next sprint or back to the backlog in a single dialog. The issue keeps its history, but no report puts that history in front of leadership.
Each sprint looks like a fresh start. The burndown resets to zero every two weeks, so a team that has missed the same three epics for two months still starts every sprint with a clean chart.
The same issue can be "nearly done" for a quarter. Large stories that were never broken down roll forward sprint after sprint, each time 80% complete according to the stand-up, never actually closed.
The result: a planning process that looks healthy at the sprint level and is consistently wrong at the roadmap level — and nobody can say exactly where the gap comes from.
Why This Matters: Roadmaps Are Built on Sprint Commitments
The Roadmap Credibility Problem
Product and business leaders build launch dates, customer commitments and revenue forecasts by multiplying team velocity by the number of sprints left. If a team routinely finishes only 60% of what it plans, every date built on its plan is off by the same margin — and the error compounds across every dependent team. After two or three missed quarters, leadership stops trusting engineering estimates at all.
The Hidden Capacity Problem
Carryover isn't free. Every unfinished issue gets re-discussed in planning, re-estimated, re-contextualized by whoever picks it up, and often reviewed twice. Teams with high carryover spend a growing share of each sprint paying interest on the last one — and because velocity only counts closed work, that cost is invisible in every standard report.
The Wrong-Fix Problem
Without data on why work carries over, organizations apply the generic fix: "commit to less." That rarely helps. Carryover usually has specific causes — oversized stories, review bottlenecks, tickets whose code has already shipped — and each one needs a different fix. Cutting commitment across the board treats all of them as the same problem.
The Enterprise Discussion: What Engineers Are Actually Saying
The say/do gap comes up again and again wherever engineering managers and leads at large organizations compare notes on planning and delivery predictability. The quotes below are representative of recurring threads on the topic.
Engineering Manager, Enterprise SaaS (r/agile)
"We've carried over between 30 and 40% of our sprint every single sprint for a year. Nobody calls it a problem because velocity looks stable. Then every quarter the roadmap slips by a month and product acts surprised. It's the same problem, we just measure it in two different places that never talk to each other."
Director of Engineering, Global Financial Services (r/ExperiencedDevs)
"Leadership asks why we can't commit to a date. The honest answer is that we don't know our own completion rate. We know velocity, which is just whatever happened to close. We don't know what we said we'd do versus what we actually did, sprint over sprint, by team."
Staff Engineer, Large E-commerce Platform (r/scrum)
"Half the 'carryover' on my team is stuff that's already merged and sitting in QA or waiting for someone to close the ticket. The other half is 13-point stories that should've been five tickets. Both look identical on the board: a card that didn't move to Done."
The pattern holds: teams already know their sprints don't finish — what's missing is a consistent, cross-team measurement of how much doesn't finish, whether it's getting worse, and what kind of work is actually carrying over.
How Keypup MCP Solves Chronic Sprint Carryover
The Keypup Model Context Protocol (MCP) Server gives your AI assistant structured access to the issues and pull requests Keypup imports from Jira, GitHub, GitLab and Bitbucket. For every Jira issue, that includes the sprint it currently sits in, every closed sprint it has already passed through with their start and end dates, its story points, its type, its workflow status history, and the pull requests linked to it. That's everything needed to measure carryover directly — no spreadsheet exports, no manual sprint reports.
1. Measuring the Real Say/Do Ratio
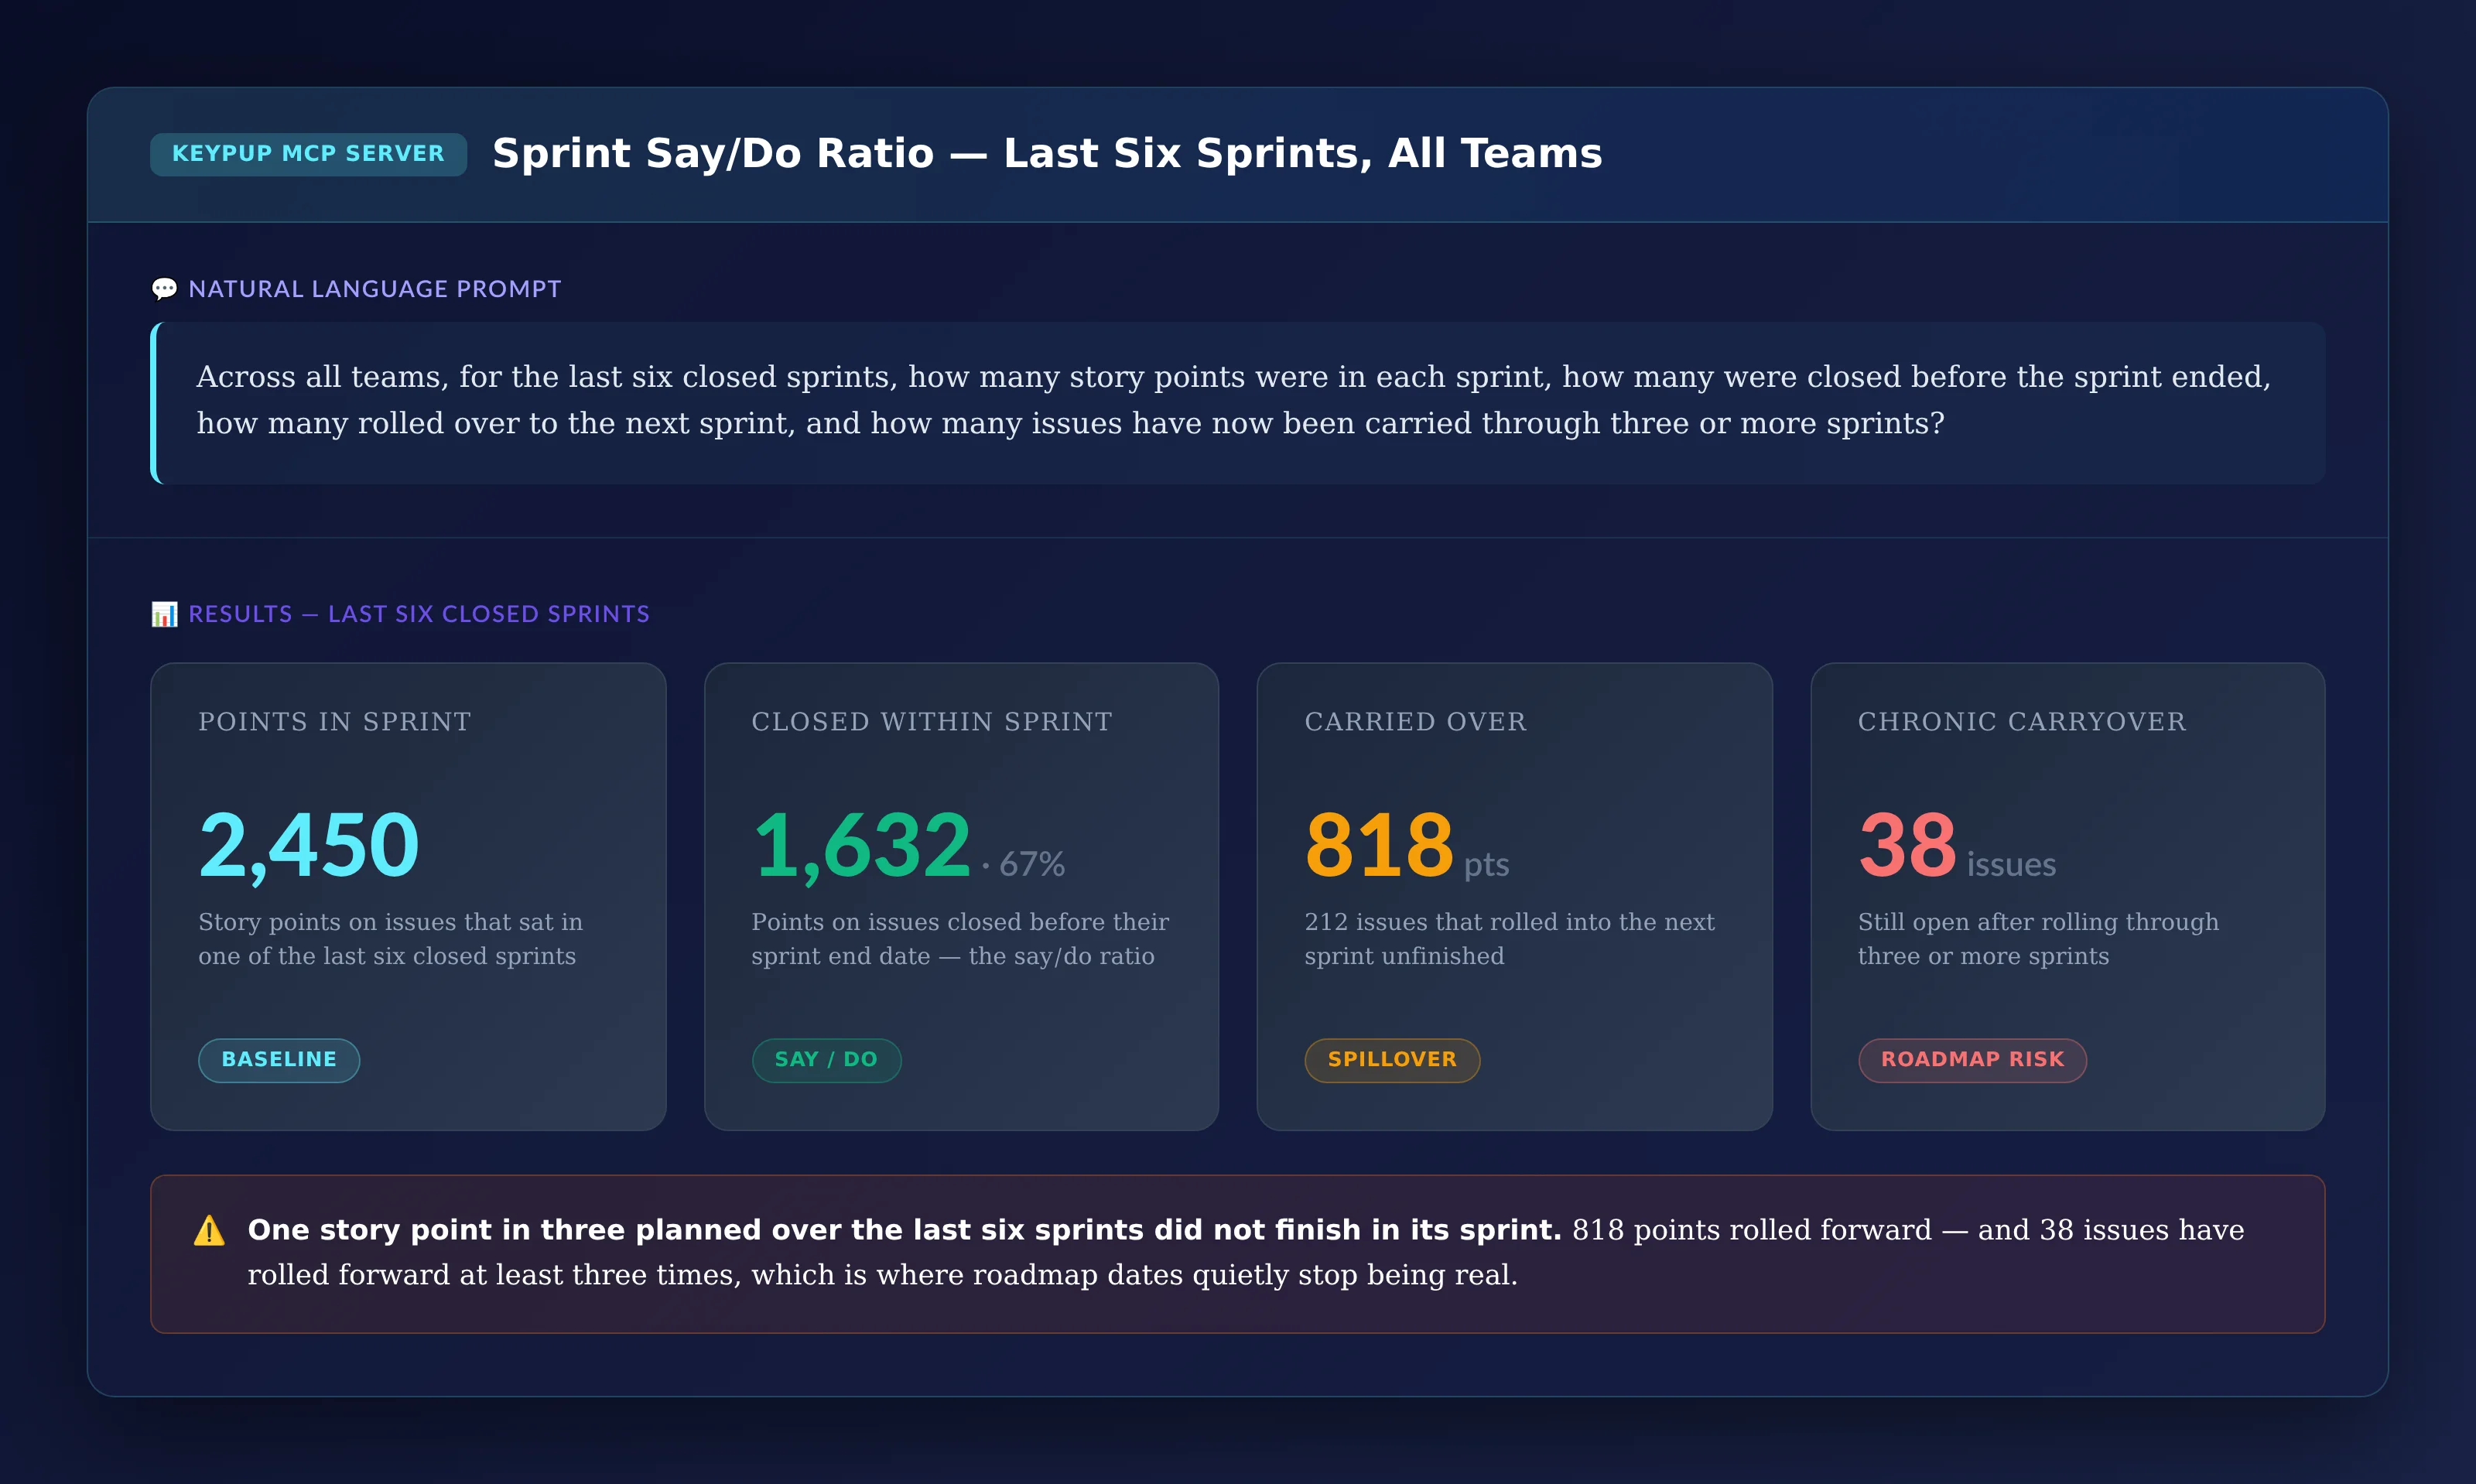
The first question is the one most teams have never answered: of all the work planned into sprints recently, how much actually finished in the sprint it was planned for?
MCP Prompt:
Across all teams, for the last six closed sprints, how many
story points were in each sprint, how many were closed before
the sprint ended, how many rolled over to the next sprint, and
how many issues have now been carried through three or more
sprints?
Output: Sprint Say/Do Ratio — Last Six Sprints, All Teams
Key Insight: One story point in three planned over the last six sprints did not finish in its sprint. 818 points on 212 issues rolled forward, and 38 issues have rolled forward at least three times. That last number is where roadmap dates stop being real: work that has missed three sprints in a row is not "almost done," it is unplanned.
2. Proving Whether Predictability Is Improving or Eroding
A single ratio is a snapshot. Leadership needs to know which way it's moving.
MCP Prompt:
Plot story points in each of the last eight sprints against
points closed before the sprint end date, with the say/do
ratio as a line.
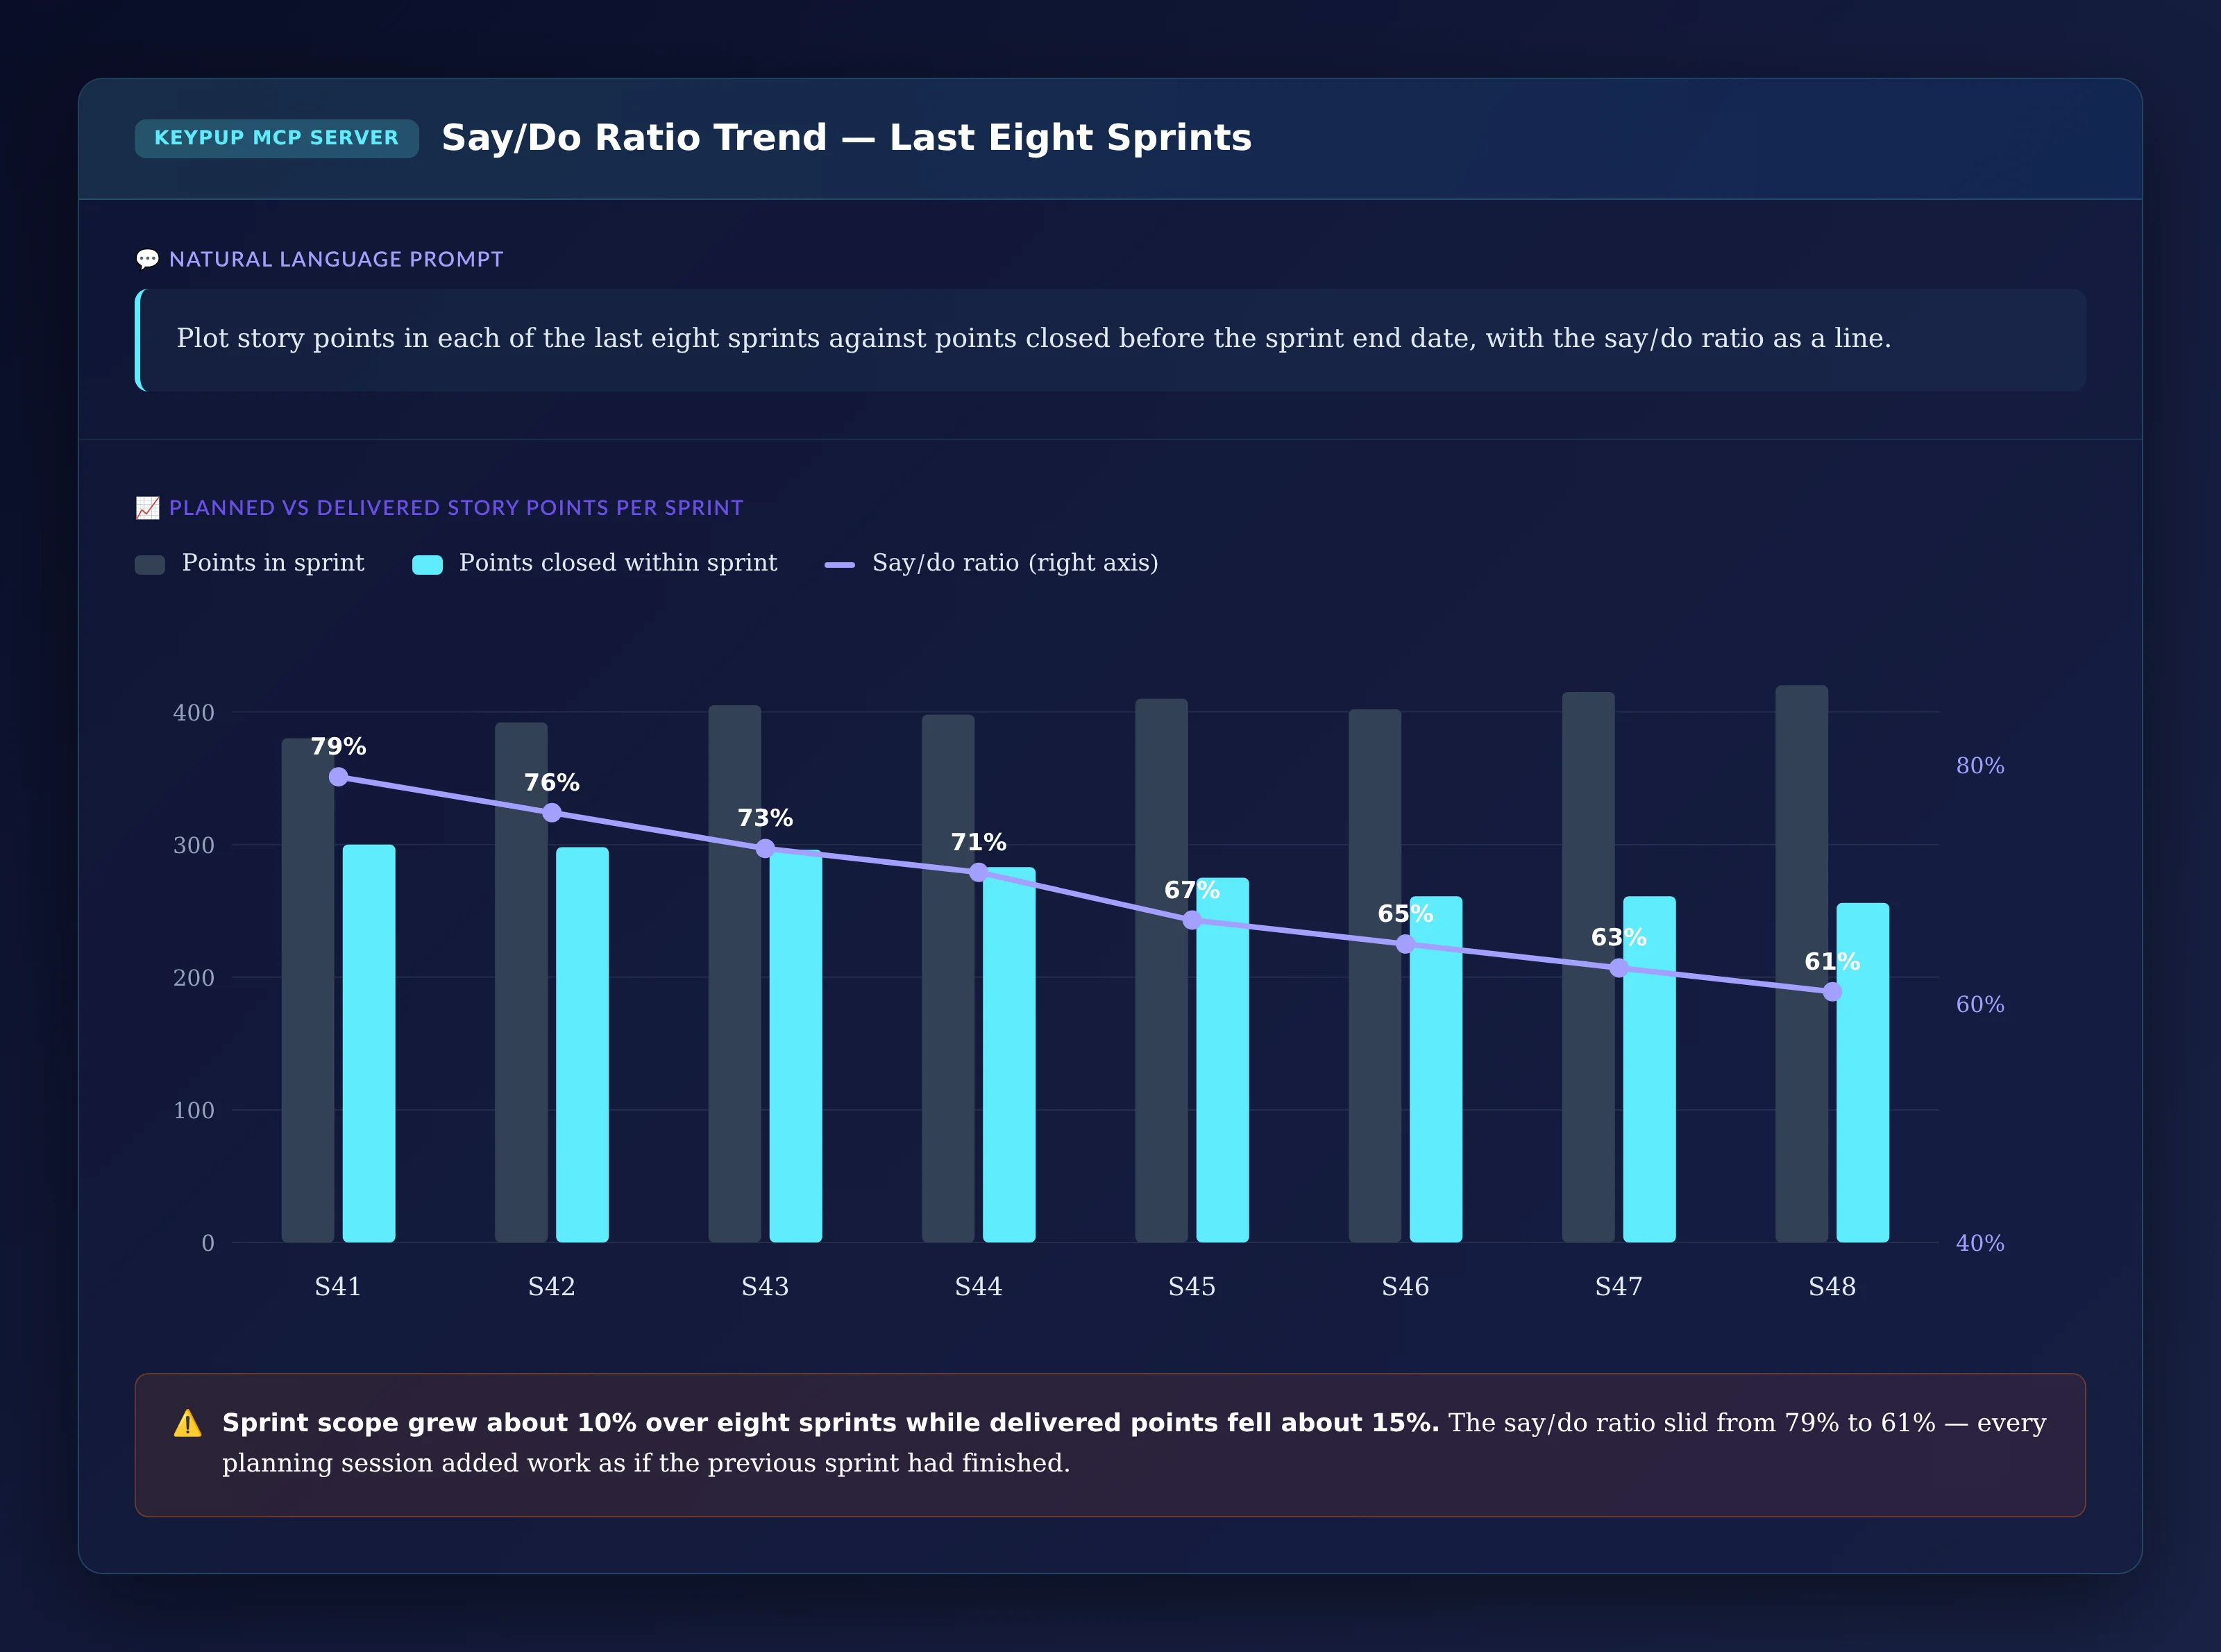
Output: Say/Do Ratio Trend — Last Eight Sprints
Key Insight: Sprint scope grew about 10% over eight sprints while delivered points fell about 15%. The say/do ratio slid from 79% to 61%. Each planning session loaded work as if the previous sprint had finished — the clearest possible signal that planning is driven by the roadmap, not by measured capacity.
3. Separating "Not Started" from "Already Shipped"
Not all carryover is the same. Before deciding how to fix it, leadership needs to know what the unfinished work is actually waiting on. Keypup links each Jira issue to the pull requests that reference it and records whether those pull requests are open or merged.
MCP Prompt:
For the issues that rolled over from the last six sprints,
break them down by the state of their linked pull requests:
no pull request, pull request still open, or all pull
requests merged.
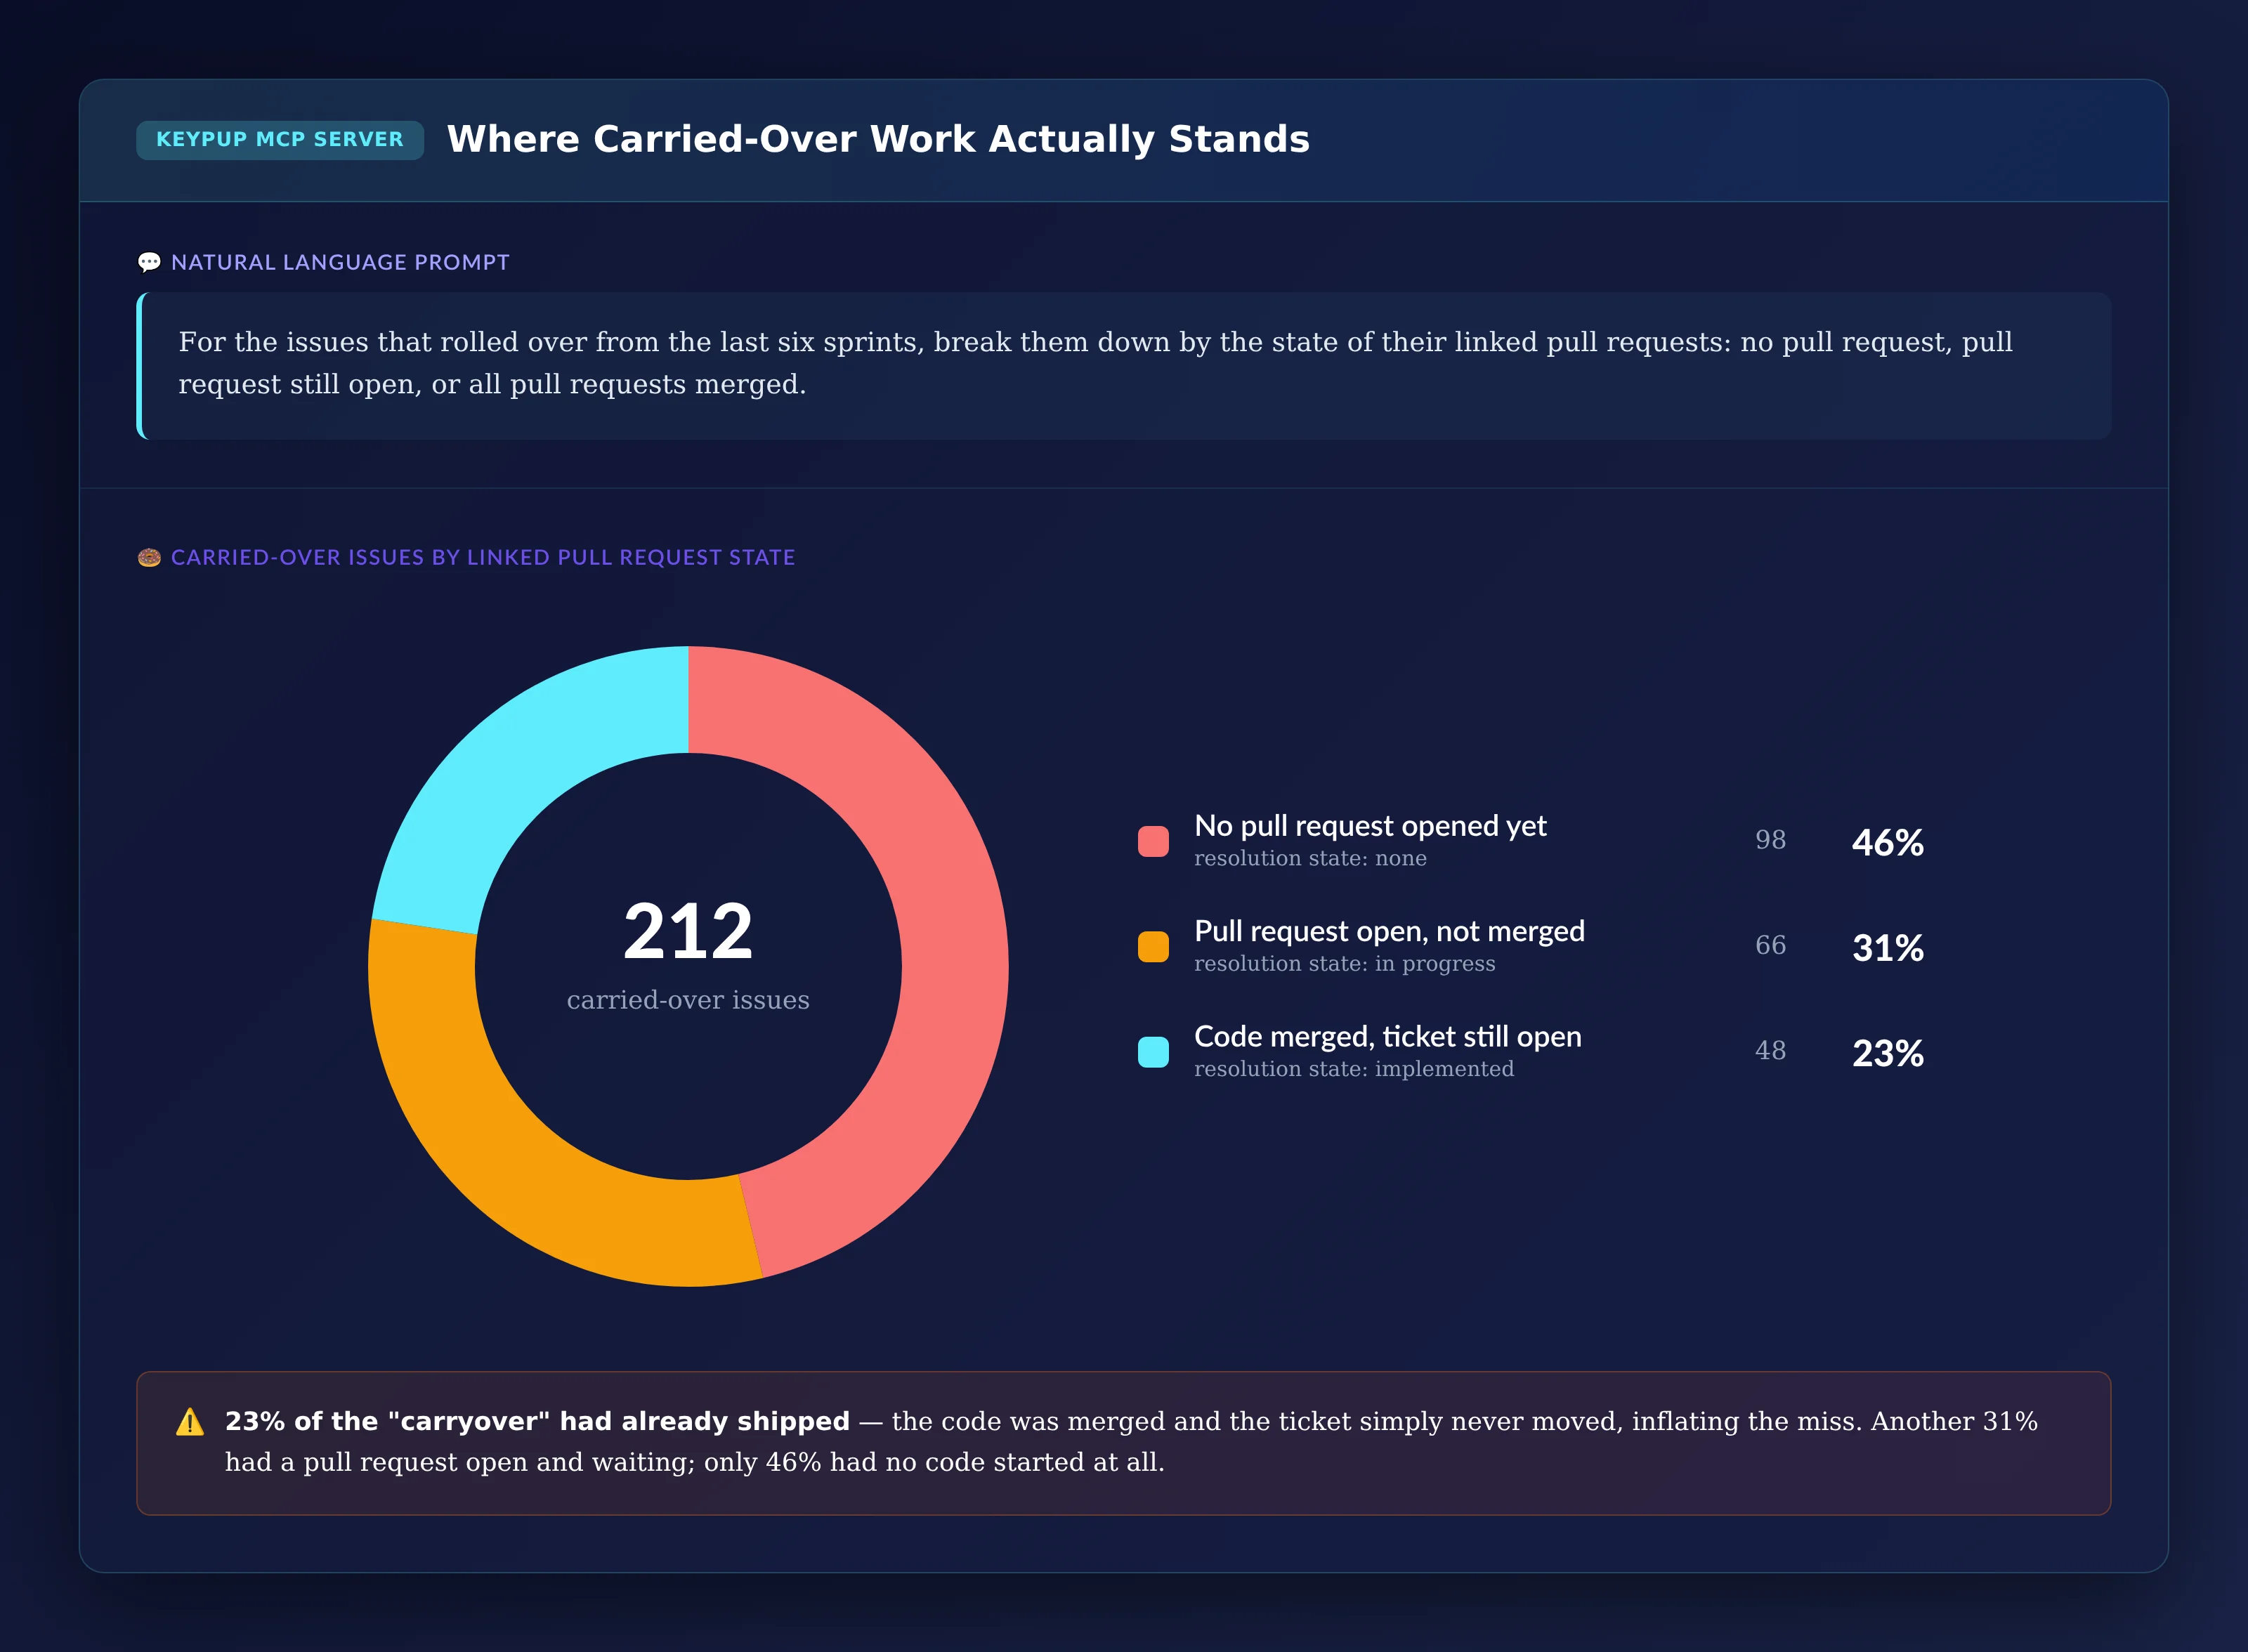
Output: Where Carried-Over Work Actually Stands
Key Insight: 23% of the carryover had already shipped — the code was merged and the ticket simply never moved, inflating the miss. Another 31% had a pull request open and waiting, which points to review throughput rather than planning. Only 46% had no code started at all. Three different causes, three different fixes — none of them "commit to less."
4. Finding What Kind of Work Carries Over
The next question is whether carryover is a team problem or a work-shape problem. Story points and the Jira Team field answer it in one view.
MCP Prompt:
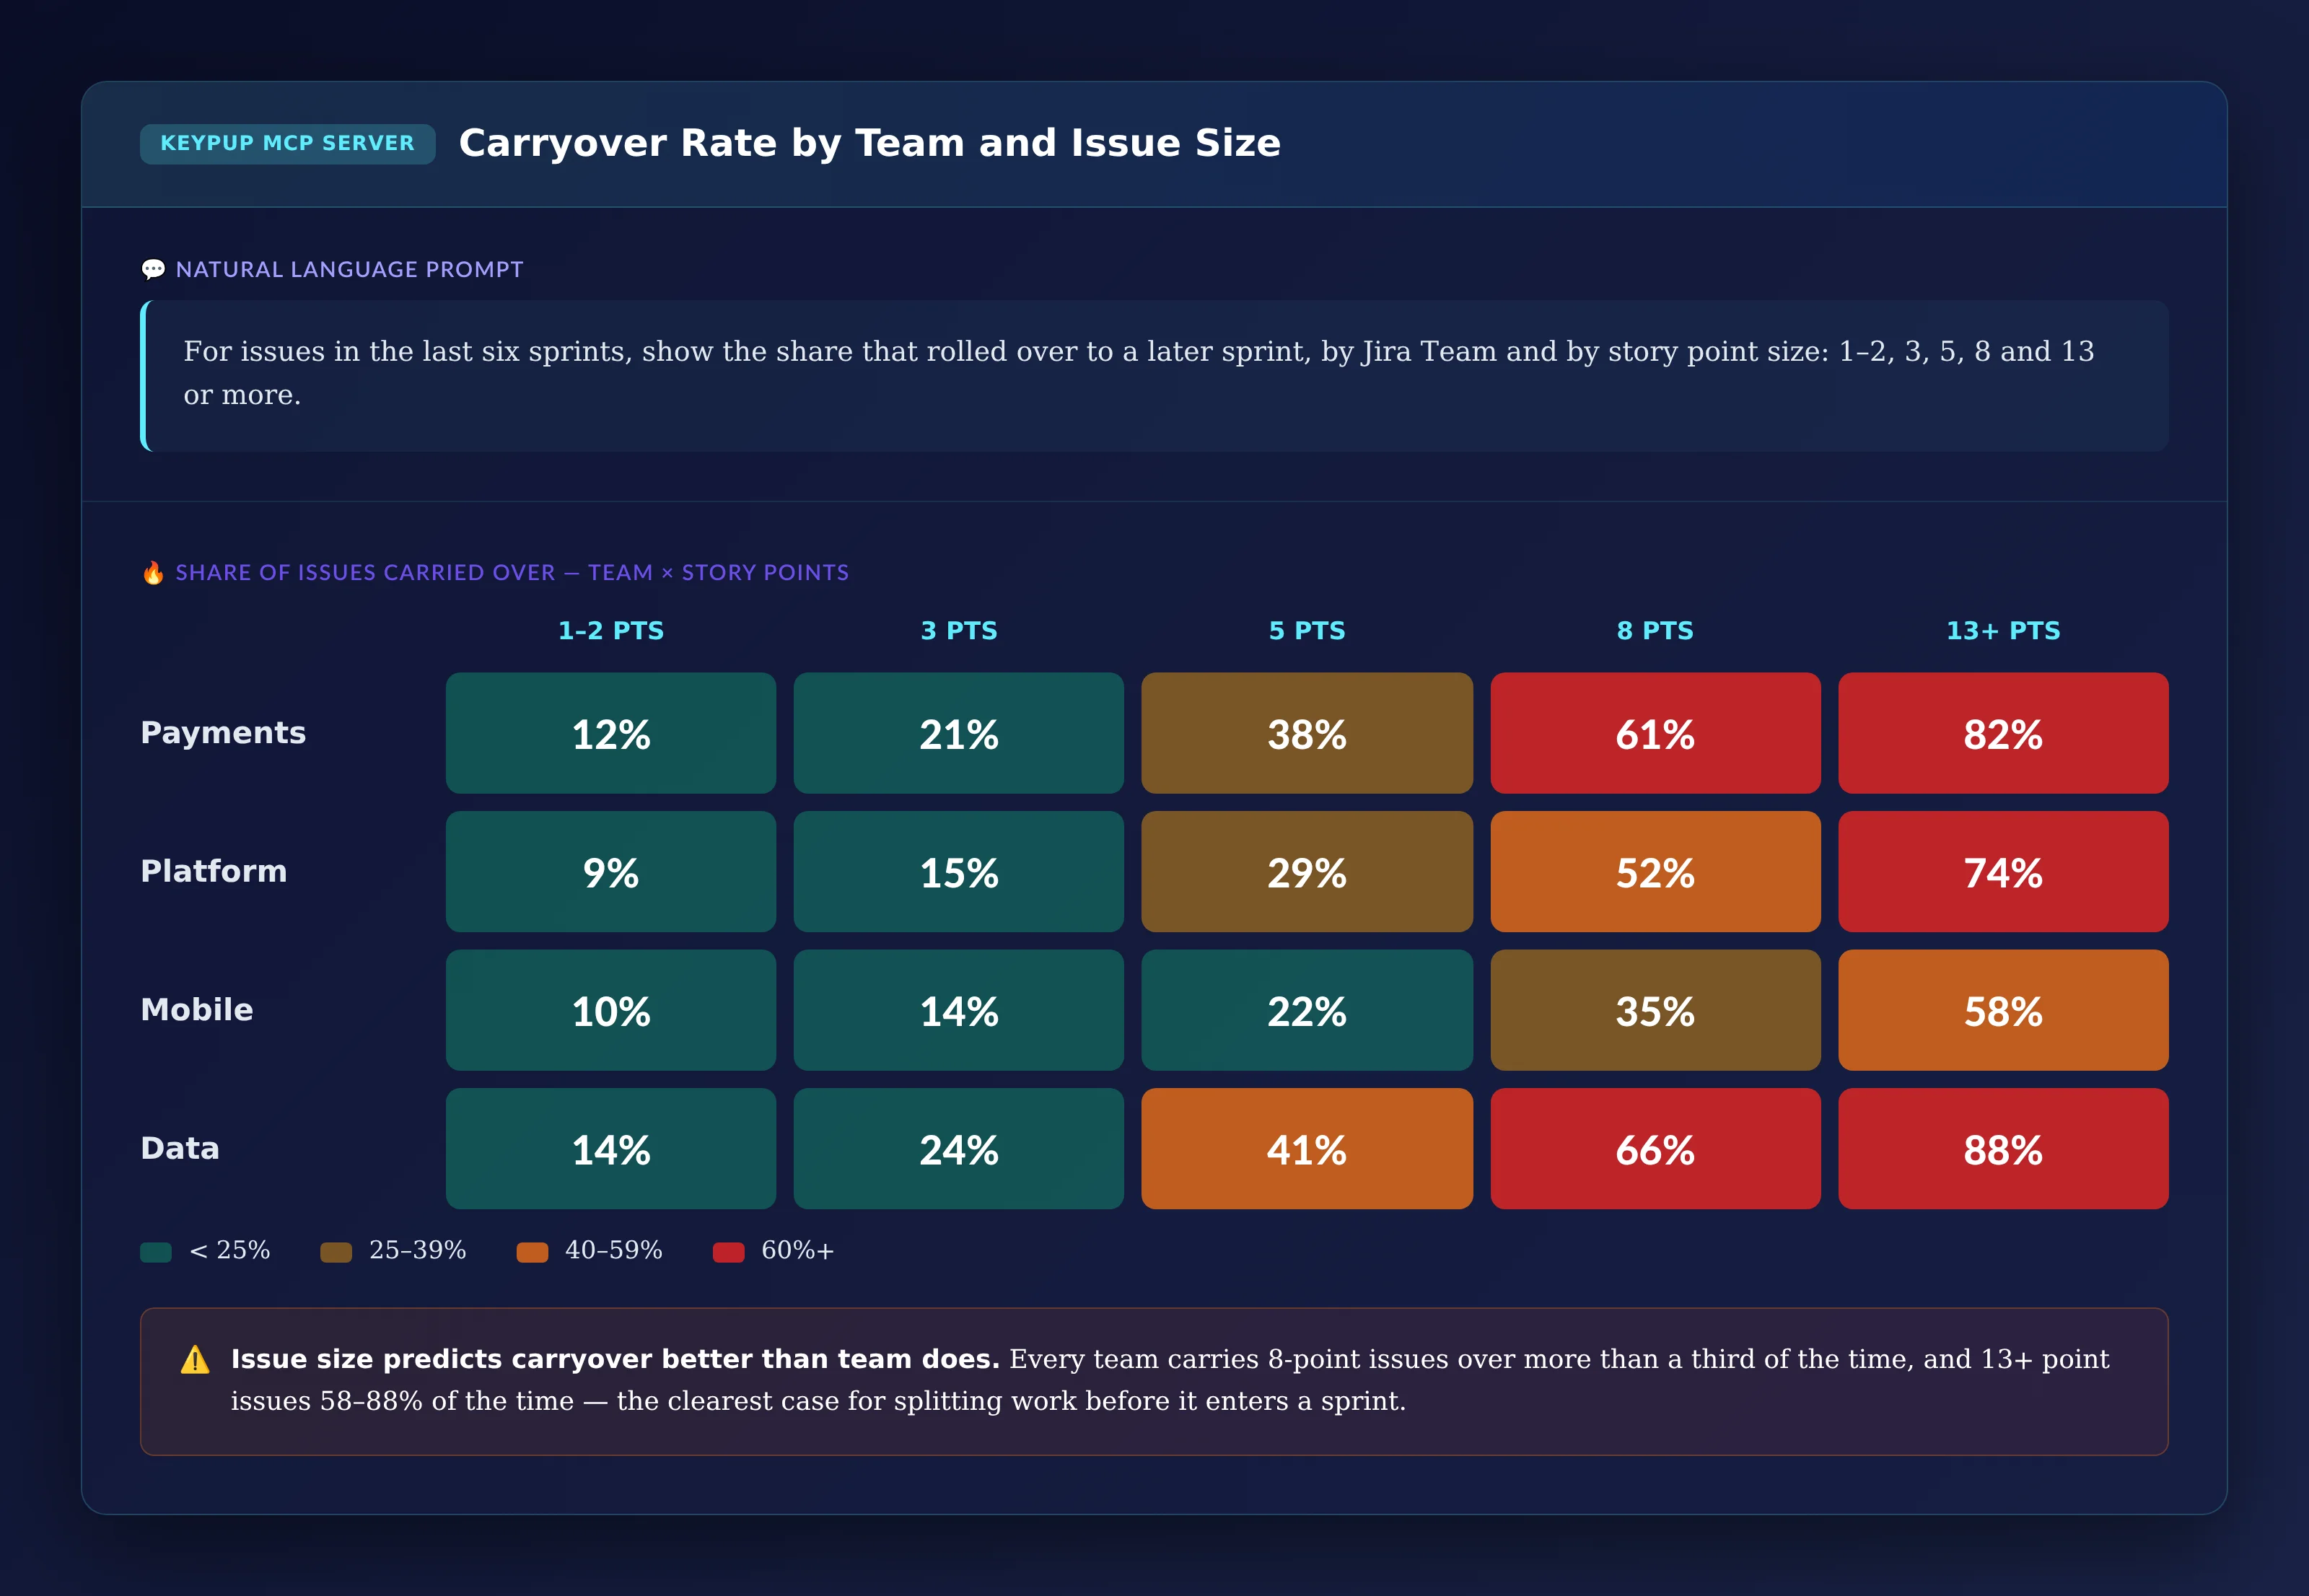
For issues in the last six sprints, show the share that rolled
over to a later sprint, by Jira Team and by story point size:
1–2, 3, 5, 8 and 13 or more.
Output: Carryover Rate by Team and Issue Size
Key Insight: Issue size predicts carryover better than team does. Every team carries 8-point issues over more than a third of the time, and 13+ point issues 58–88% of the time. Small issues finish almost everywhere. The single most effective planning rule this data supports: nothing above 5 points enters a sprint without being split.
5. Getting the List of Chronic Carryovers
For the planning conversation, leads need the exact issues that keep rolling forward — ranked, with enough context to decide whether to split, descope or escalate each one.
MCP Prompt:
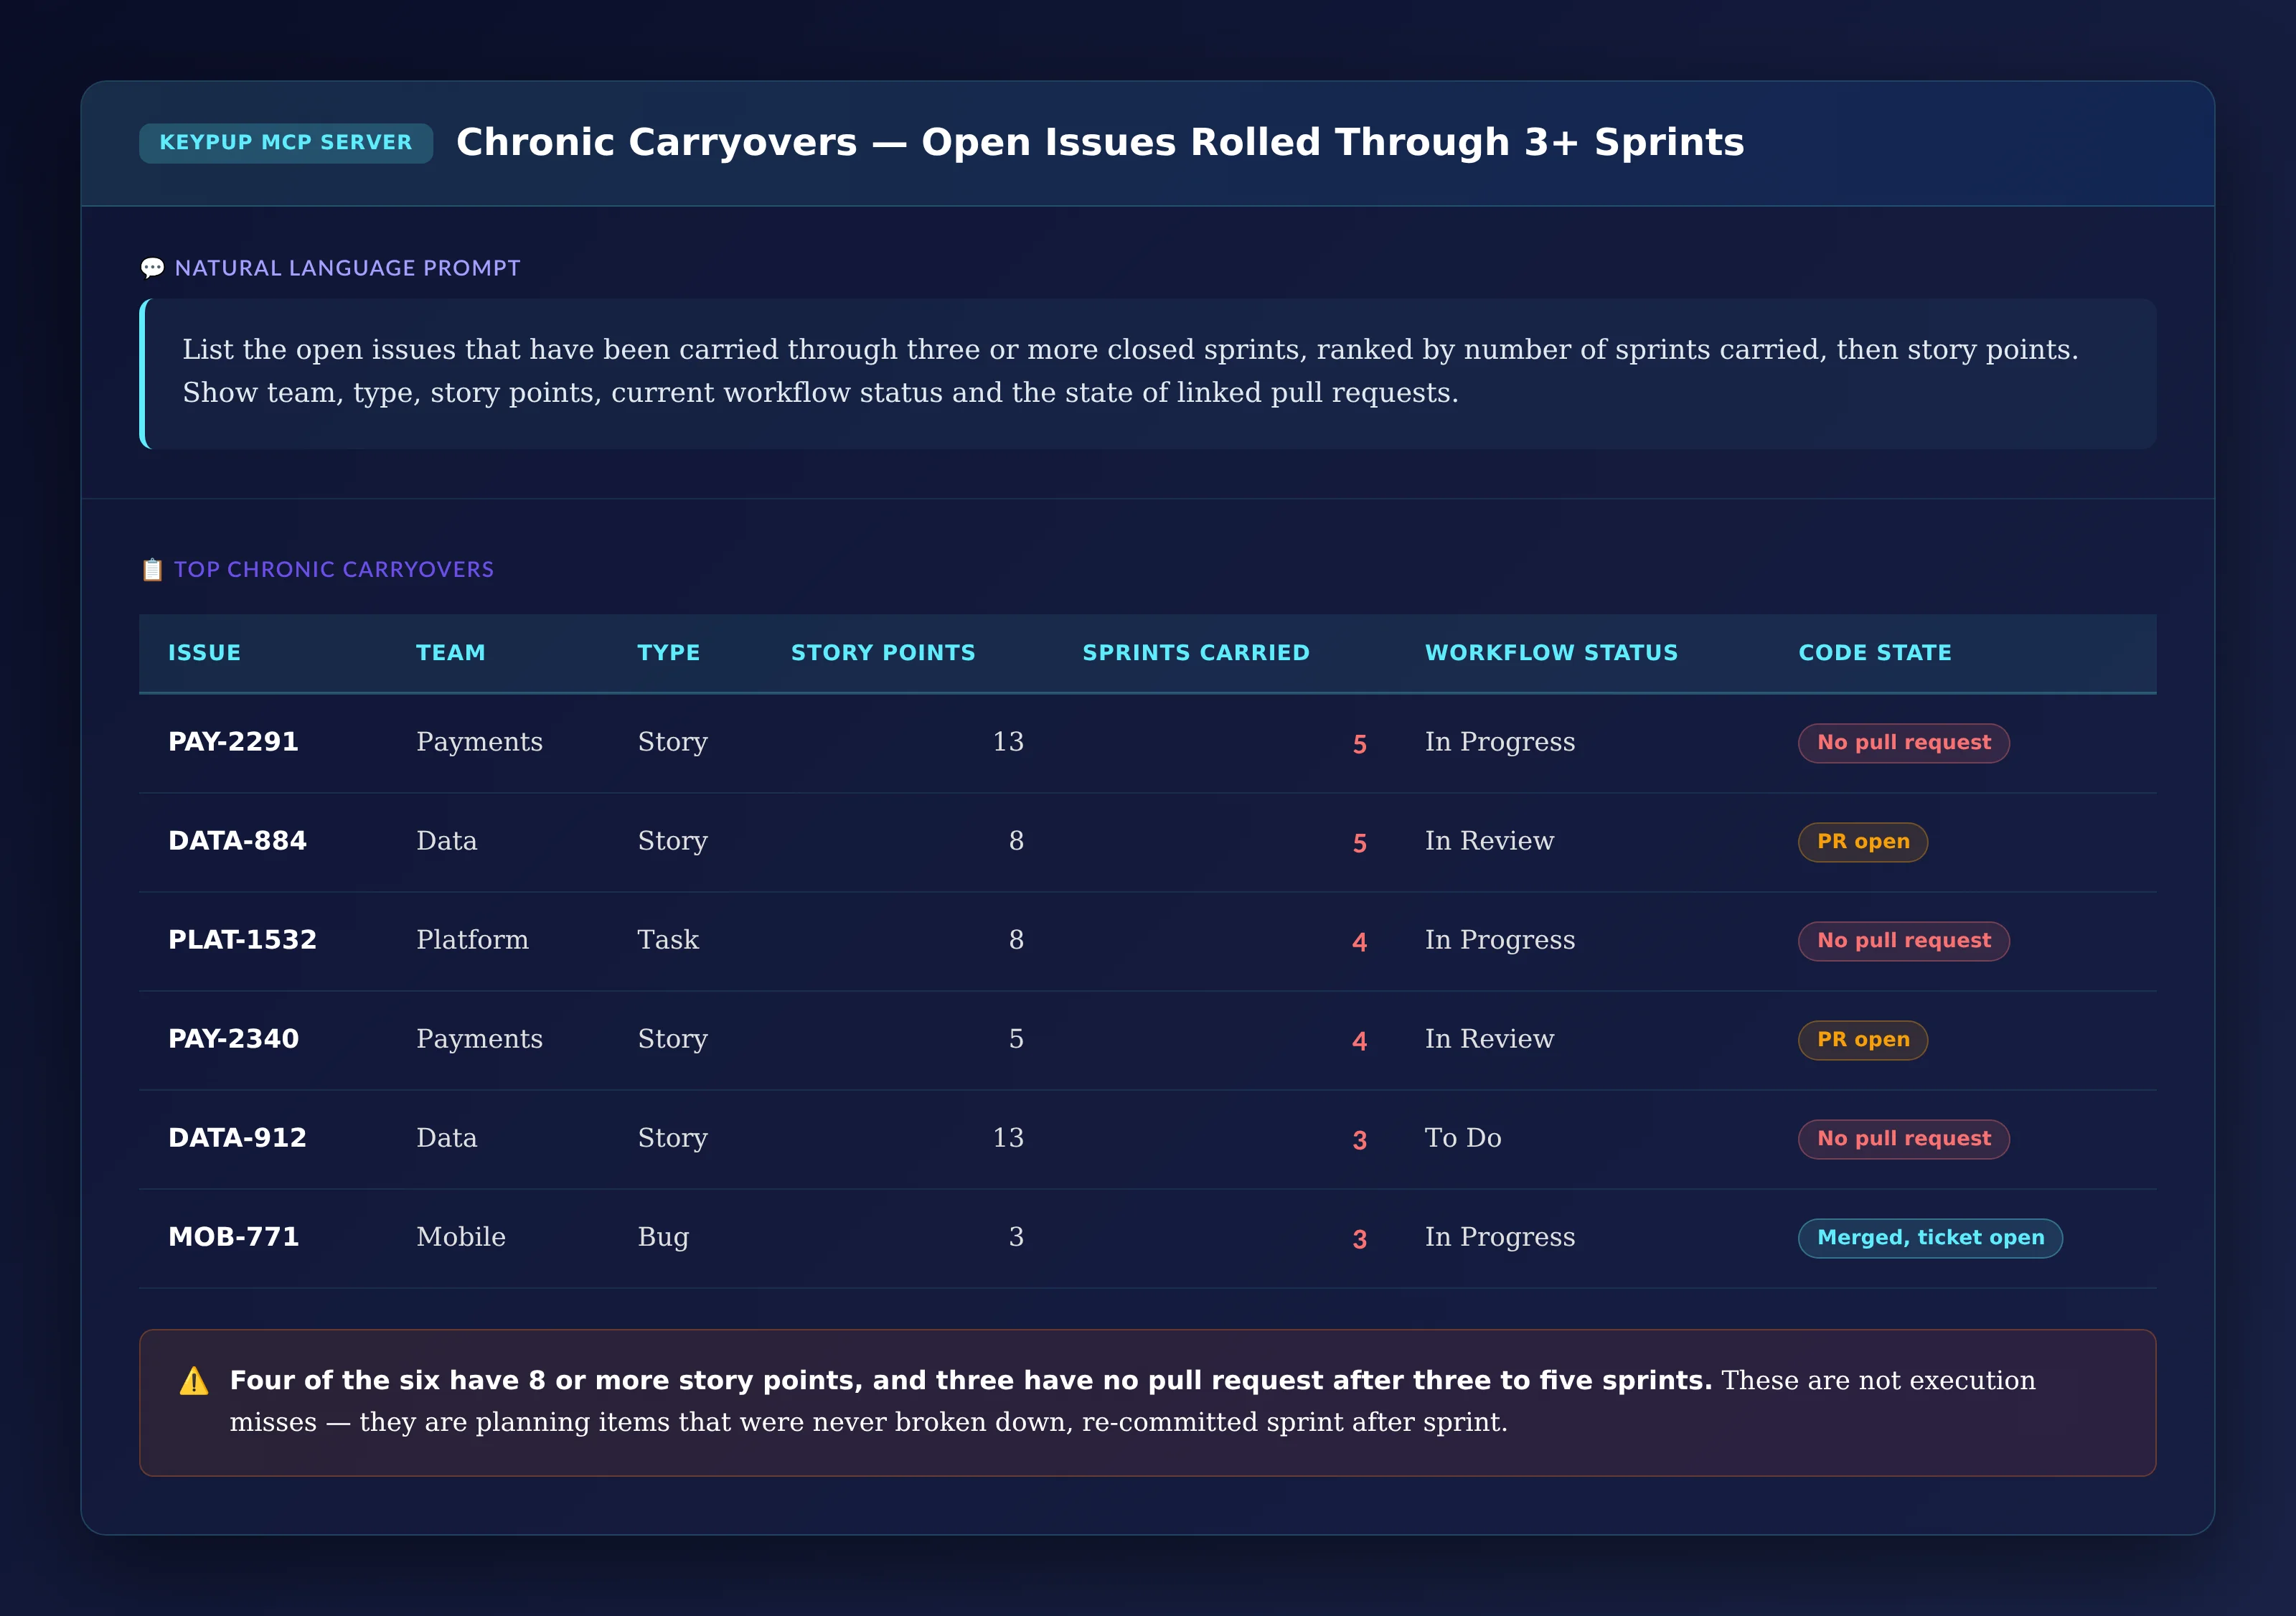
List the open issues that have been carried through three or
more closed sprints, ranked by number of sprints carried, then
story points. Show team, type, story points, current workflow
status and the state of linked pull requests.
Output: Chronic Carryovers — Open Issues Rolled Through 3+ Sprints
Issue
Team
Type
Story Points
Sprints Carried
Workflow Status
Code State
PAY-2291
Payments
Story
13
5
In Progress
No pull request
DATA-884
Data
Story
8
5
In Review
PR open
PLAT-1532
Platform
Task
8
4
In Progress
No pull request
PAY-2340
Payments
Story
5
4
In Review
PR open
DATA-912
Data
Story
13
3
To Do
No pull request
MOB-771
Mobile
Bug
3
3
In Progress
Merged, ticket open
Key Insight: Four of the six have 8 or more story points, and three have no pull request after three to five sprints. These are not execution misses — they are planning items that were never broken down and were re-committed sprint after sprint. MOB-771 is the opposite case: the fix is merged, and the ticket just needs to be closed.
6. Giving Leadership a Standing Predictability Scorecard
With the causes understood, leadership needs one view that shows where delivery dates can be trusted and where they can't.
MCP Prompt:
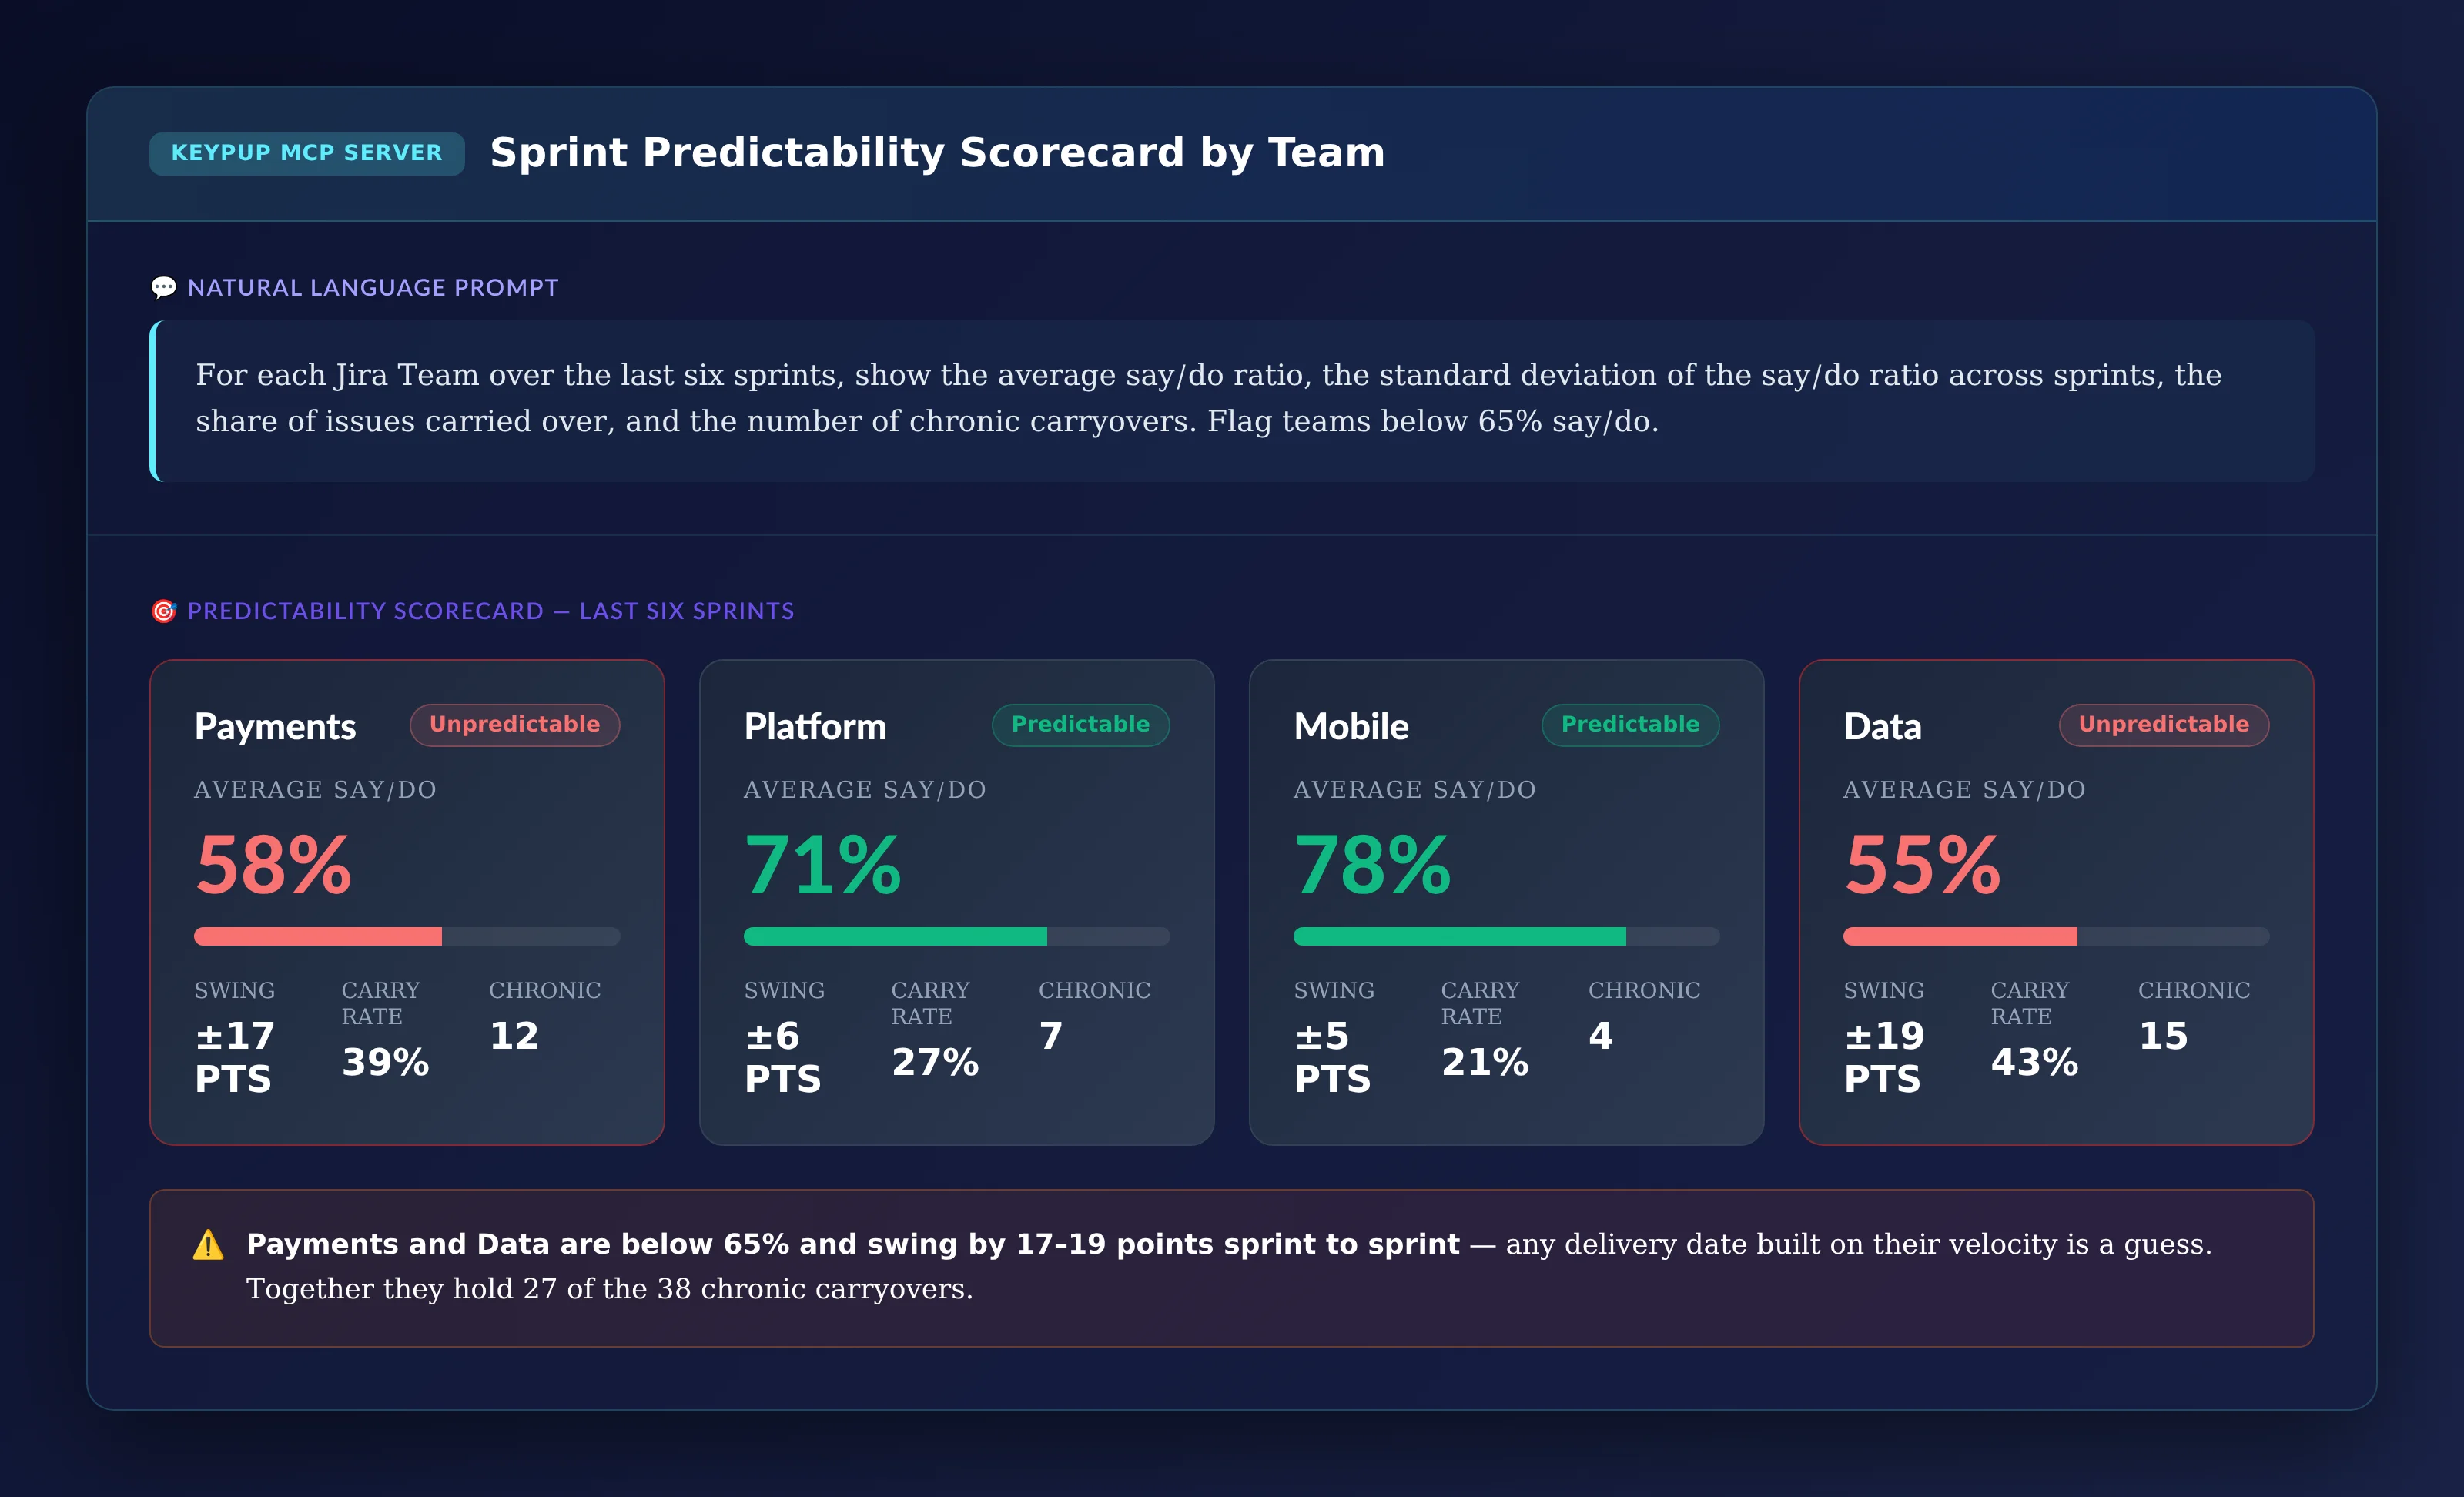
For each Jira Team over the last six sprints, show the average
say/do ratio, the standard deviation of the say/do ratio across
sprints, the share of issues carried over, and the number of
chronic carryovers. Flag teams below 65% say/do.
Output: Sprint Predictability Scorecard by Team
Key Insight: Payments and Data are below 65% and swing by 17–19 points from sprint to sprint — any delivery date built on their velocity is a guess. Together they hold 27 of the 38 chronic carryovers. Mobile and Platform are steady enough to plan against. That's a targeted conversation with two teams, not an organization-wide mandate.
The Technical Implementation: What Keypup MCP Actually Reads
Every number above comes from fields Keypup already imports from Jira and your Git platform. It helps to be precise about what those are — and what they aren't.
Sprint History Comes From Jira
For every Jira issue, Keypup records the sprint it currently belongs to — with its name, state, start, end and close dates — and every closed sprint the issue passed through before that one. An issue with one or more past sprints has carried over; the number of past sprints is how many times it carried over. That's what drives the carryover counts, the chronic carryover list and the "sprints carried" column.
How the Say/Do Ratio Is Defined
Keypup computes say/do as story points on issues closed on or before their sprint's end date, divided by story points on all issues in that sprint. Two limits are worth knowing. First, Keypup stores which sprints an issue belonged to, not a snapshot of the sprint as it stood on planning day, so work added mid-sprint counts as part of the sprint; if your teams add a lot of scope mid-sprint, read the ratio as "completion rate" rather than "commitment kept." Second, points use each issue's current story point value, so issues re-estimated between sprints count at their latest estimate.
Story Points and Teams Are Your Jira Fields
The ratios use your Jira Story Points field, so they assume your teams estimate in points; teams that don't can run the same prompts on issue counts instead. Grouping by team uses your Jira Team field (or whichever field you use to assign issues to teams). Keypup imports custom fields as they are, so the team breakdowns in the heatmap and scorecard only work if that field is filled in consistently.
Code State Depends on Linking
Keypup links a pull request to the Jira issues it references, and tracks whether each issue's linked pull requests are open or merged. If your engineers don't reference ticket keys in their pull requests, every carried-over issue will show as "no pull request" — so check your linking rate before relying on the donut breakdown.
Scorecard Variability Is Computed From Per-Sprint Results
The "swing" on the scorecard is the standard deviation of each team's per-sprint say/do ratio. The assistant first computes the ratio per team per sprint, then summarizes it — the same per-sprint numbers that drive the trend chart, grouped by team.
Real-World Impact: Enterprise Case Studies
Case Study 1: Global Insurance Software Provider
Before Keypup MCP:
Twelve teams reported stable velocity every sprint while the annual roadmap slipped by an average of five weeks per quarter
Planning meetings re-committed the same large stories sprint after sprint, with no record of how many times each had already been carried
Product leadership had stopped using engineering estimates and was padding every external date by 50%
After Keypup MCP:
Say/do was reported per team every sprint alongside velocity, making the gap between planned and finished work visible for the first time
Any issue above 5 points was split before sprint planning, after the size heatmap showed large stories accounted for most of the carryover
Average say/do rose from 61% to 79% within two quarters, and roadmap padding was cut in half
"We'd been reporting velocity for years and it never told us anything. The first time we put say/do next to it, the roadmap slips stopped being a mystery. It was the same twenty oversized stories, carried sprint after sprint, every quarter."
— VP Engineering, Global Insurance Software Provider
Case Study 2: Enterprise Logistics Platform
Before Keypup MCP:
Carryover was treated as a single number and addressed with a blanket "commit 20% less" rule across all teams
Committed scope dropped but carryover didn't, and delivery dates slipped further
No one could tell how much of the unfinished work was actually blocked versus already shipped
After Keypup MCP:
The pull request state breakdown showed a quarter of carried-over issues already had merged code, and closing them became part of the sprint review checklist
Issues waiting on an open pull request were routed to a review rotation, rather than re-planned as unfinished work
The blanket commitment cut was reversed for the two teams with steady say/do, recovering capacity without hurting predictability
"We were cutting commitments to fix a problem that was half bookkeeping and half code review. Once we could see which carryover was which, the fixes were obvious — and none of them was 'do less.'"
— Director of Engineering, Enterprise Logistics Platform
Implementation: Getting Started with Keypup MCP
1. Connect Jira and Your Git Platform
Connect Jira and GitHub, GitLab or Bitbucket to Keypup. Sprint history, story points, workflow statuses and pull request links are imported automatically.
2. Check Your Field Hygiene
Confirm your teams fill in Story Points and the Team field, and that pull requests reference Jira ticket keys. These three habits decide how precise every view above can be.
3. Connect the MCP Server to Your AI Assistant
Follow the MCP documentation to connect Keypup to Claude, ChatGPT, Cursor or any MCP-compatible assistant.
4. Establish Your Baseline
Run the say/do and trend prompts for the last six to eight sprints. Most organizations find their real completion rate is 15–30 points lower than they assumed.
5. Make It a Sprint Ritual
Add the chronic carryover list to every sprint planning session and the team scorecard to the monthly delivery review, so carryover gets addressed while it's still one sprint old.
The Bottom Line
Chronic sprint carryover is the most common reason enterprise roadmaps slip, and the least measured. Keypup MCP turns it into a number every team and leader can see:
✅ Measuring the real say/do ratio, not just velocity ✅ Tracking whether predictability is improving or eroding, sprint over sprint ✅ Separating unstarted, in-review and already-merged carryover, so each gets the right fix ✅ Showing how issue size drives carryover, by team ✅ Listing chronic carryovers for every planning session ✅ Maintaining a standing predictability scorecard by team, so roadmap dates rest on measured capacity
When leadership can see what was planned against what actually finished, roadmap dates stop being a negotiation and become a forecast.
Get Started
Ready to measure what your teams actually deliver against what they plan?
Start Free Trial — Connect Jira and your Git platform in minutes and see your real say/do ratio today.
Request Demo — See how enterprise engineering leaders use Keypup MCP to turn sprint carryover into a predictability metric.
View MCP Documentation — Technical details for engineering teams connecting Keypup MCP to Jira and their Git platform.
Keywords: sprint carryover, sprint spillover, say/do ratio, sprint commitment reliability, delivery predictability, roadmap slippage, Jira sprint analytics, story point completion rate, agile predictability metrics, MCP server engineering analytics
Ready to Transform Your Analytics?
Join teams already using AI to make data-driven decisions faster than
ever.
Enterprise code freezes exist to protect regulated, revenue-critical systems during high-risk windows — but "emergency exception" approvals are quietly becoming the default way to bypass them. Discover what engineers on Reddit say about freeze exception sprawl, and how Keypup MCP reconciles every pull request merged during a freeze against its Jira change request and review trail to close the gap before an auditor finds it first.
Compare the 6 best development analytics software platforms for 2026 — Keypup, LinearB, Jellyfish, Swarmia, Appfire Flow and Faros — across DORA Metrics tracking, engineering dashboards, Git-to-ticketing data integration, custom KPI configurability, AI capabilities, setup time and data security. Find out which engineering intelligence platform turns raw Git and Jira data into prescriptive, actionable insights for your team.
Blameless postmortems produce great root-cause analysis and action items that quietly die in the backlog. See what SREs on Reddit say about remediation decay, and how Keypup MCP tracks action item follow-through to stop the same incidents from recurring.