The QA Ping-Pong Tax: How Tickets Bouncing Between Dev and QA Quietly Inflate Your Cycle Time
When tickets bounce between development, code review and QA, every loop adds days of hidden rework that velocity and cycle-time averages never show. Learn what engineering leaders on Reddit say about QA ping-pong, why it stays invisible in enterprise reporting, and how Keypup MCP reads Jira workflow history and linked pull requests to measure rework loops, their cost and where they start.
TL;DR: In many enterprise engineering organizations, one closed ticket in six goes back to "In Progress" at least once — bounced by code review, by QA, or reopened after it was marked Done. Each loop roughly triples the ticket's cycle time, yet no standard report shows it: velocity counts the ticket once, and cycle-time averages blend it into everything else. The Keypup MCP Server reads the full Jira workflow status history of every issue and the pull requests linked to it, so your AI assistant can measure your rework loop rate, the business days lost to second passes, where loops start, which teams and change sizes loop the most, and which tickets needed new code after the first merge.
Ask an engineering leader why a feature took six weeks instead of two, and you'll rarely hear "we built it three times." But that is often what happened. The ticket went to review, came back. Went to QA, came back. Got marked Done, got reopened. Each trip is small enough to look like normal work. Together, they are one of the largest and least measured costs in enterprise software delivery.
The Friction: Work That Is "Done" More Than Once
QA ping-pong — also called bounce-back, rework loops or the dev/QA merry-go-round — is what happens when a ticket moves forward through the workflow and then back again. A developer moves it to review or QA, it fails, and it returns to "In Progress." Sometimes it does this three or four times before it finally closes.
It stays invisible for structural reasons:
Velocity counts the ticket once. A story that took three passes still contributes its story points exactly once. The two extra passes add no points, so they never show up as lost capacity.
Averages swallow the outliers. Average cycle time blends clean tickets with looped ones. A team can have a healthy-looking average while a sixth of its work takes three times as long.
Nobody owns the loop. Development sees a QA problem. QA sees a quality problem. Product sees a requirements problem. Without data, every function points at the next one.
The board only shows the present. A Jira board shows where a ticket is now, not how many times it has already been here. The history exists — in each issue's status changes — but nobody reads it at scale.
The result: organizations invest in more QA, more reviewers or more automated tests without knowing how much rework they have, where it starts, or whether it is getting better.
Why This Matters: Every Loop Costs More Than the First Pass
The Queue Problem
A loop is not just the time spent fixing a defect. Each time a ticket moves backward, it re-enters a queue: it waits for the developer to switch back to it, waits again for review, waits again for a QA slot. The fix itself might take an hour. The round trip often takes a week.
The Predictability Problem
Planning assumes tickets move forward. When one in six moves backward, sprint plans and delivery dates absorb the loss silently. Leaders see "slow delivery" and look for capacity problems, when the real issue is that a large share of capacity goes into work that was already "finished" once.
The Wrong-Fix Problem
Without knowing where loops start, organizations apply the wrong fix. Adding QA staff doesn't help if loops start in code review. Adding review rules doesn't help if tickets bounce because the acceptance criteria were unclear. Every type of loop needs its own fix.
The Enterprise Discussion: What Engineers Are Actually Saying
QA bounce-back is a recurring theme wherever engineering managers, QA leads and senior engineers at large organizations compare notes. The quotes below are representative of recurring threads on r/ExperiencedDevs, r/QualityAssurance and r/agile.
QA Lead, Enterprise Fintech (r/QualityAssurance)
"Half my week is re-testing tickets I already failed. Dev fixes the one thing I flagged, moves it back to QA, and something else is broken. By the third round nobody remembers what the original acceptance criteria were. And on the burndown it all just looks like 'in testing'."
Engineering Manager, Global Retail Platform (r/ExperiencedDevs)
"Leadership keeps asking why our cycle time is so high compared to other teams. When I dug into it manually, it was a handful of tickets that went back and forth between dev and QA four or five times. The average hid all of it. I had to read status histories ticket by ticket to prove it."
Senior Engineer, Large Healthcare SaaS (r/agile)
"We 'finish' a story, it gets reopened two days later, and suddenly it's a new bug ticket in the next sprint. Our velocity looks great because we close everything twice. Nobody tracks how much of our work is redoing work."
The pattern holds: teams know tickets bounce, but nobody can say how often, how much it costs, or where the bounces start — because the evidence lives in thousands of individual status histories.
How Keypup MCP Measures QA Ping-Pong
The Keypup Model Context Protocol (MCP) Server gives your AI assistant structured access to the issues and pull requests Keypup imports from Jira, GitHub, GitLab and Bitbucket. For every Jira issue, that includes its workflow timeline — each status it entered, with start and end timestamps, in order — plus its type, its custom fields (such as Team), and the pull requests linked to it with their creation, merge and size data. That's everything needed to detect a ticket going backward, count how many business days it spent on second passes, and connect the loop to the code behind it.
1. Sizing the Rework Loop Problem
The first question is simply: how much of our closed work went backward at least once, and what did it cost?
MCP Prompt:
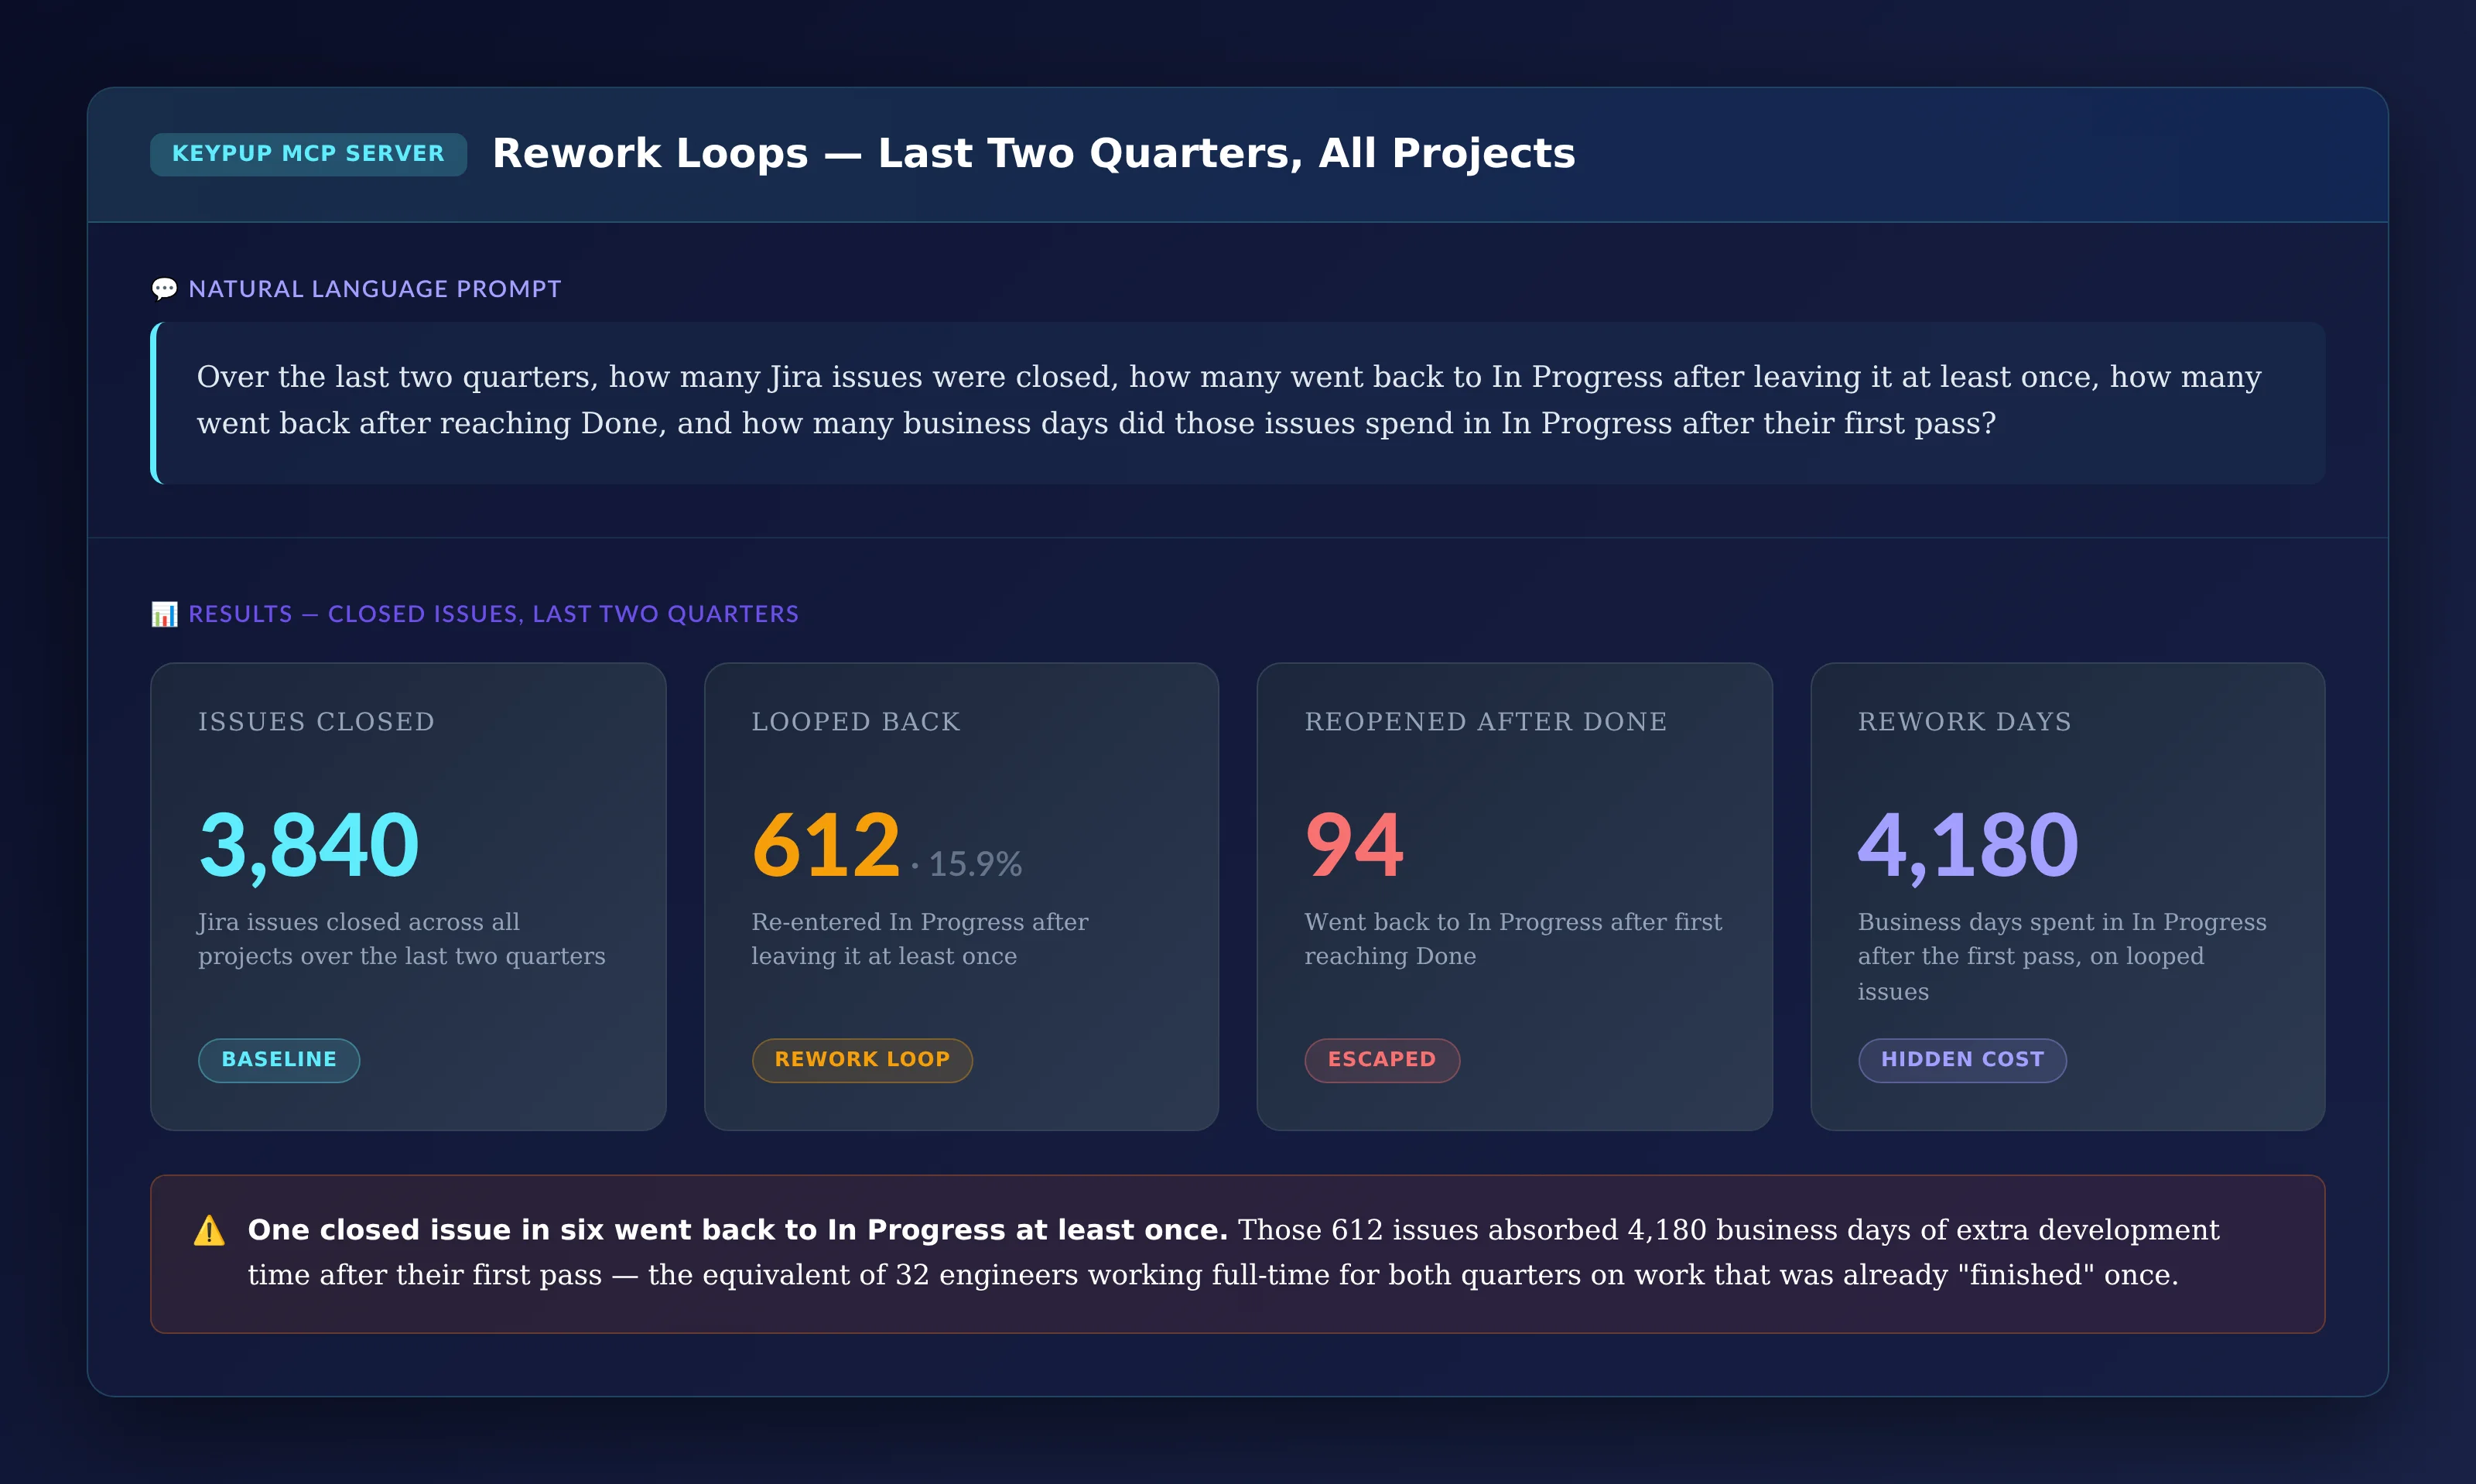
Over the last two quarters, how many Jira issues were closed,
how many went back to In Progress after leaving it at least
once, how many went back after reaching Done, and how many
business days did those issues spend in In Progress after
their first pass?
Output: Rework Loops — Last Two Quarters, All Projects
Key Insight: One closed issue in six went back to In Progress at least once. Those 612 issues absorbed 4,180 business days of extra development time after their first pass — the equivalent of 32 engineers working full-time for both quarters on work that was already "finished" once. None of it appears in velocity.
2. Finding Where Loops Start
Knowing the total isn't enough to fix it. The next question is how far each ticket got before it went back.
MCP Prompt:
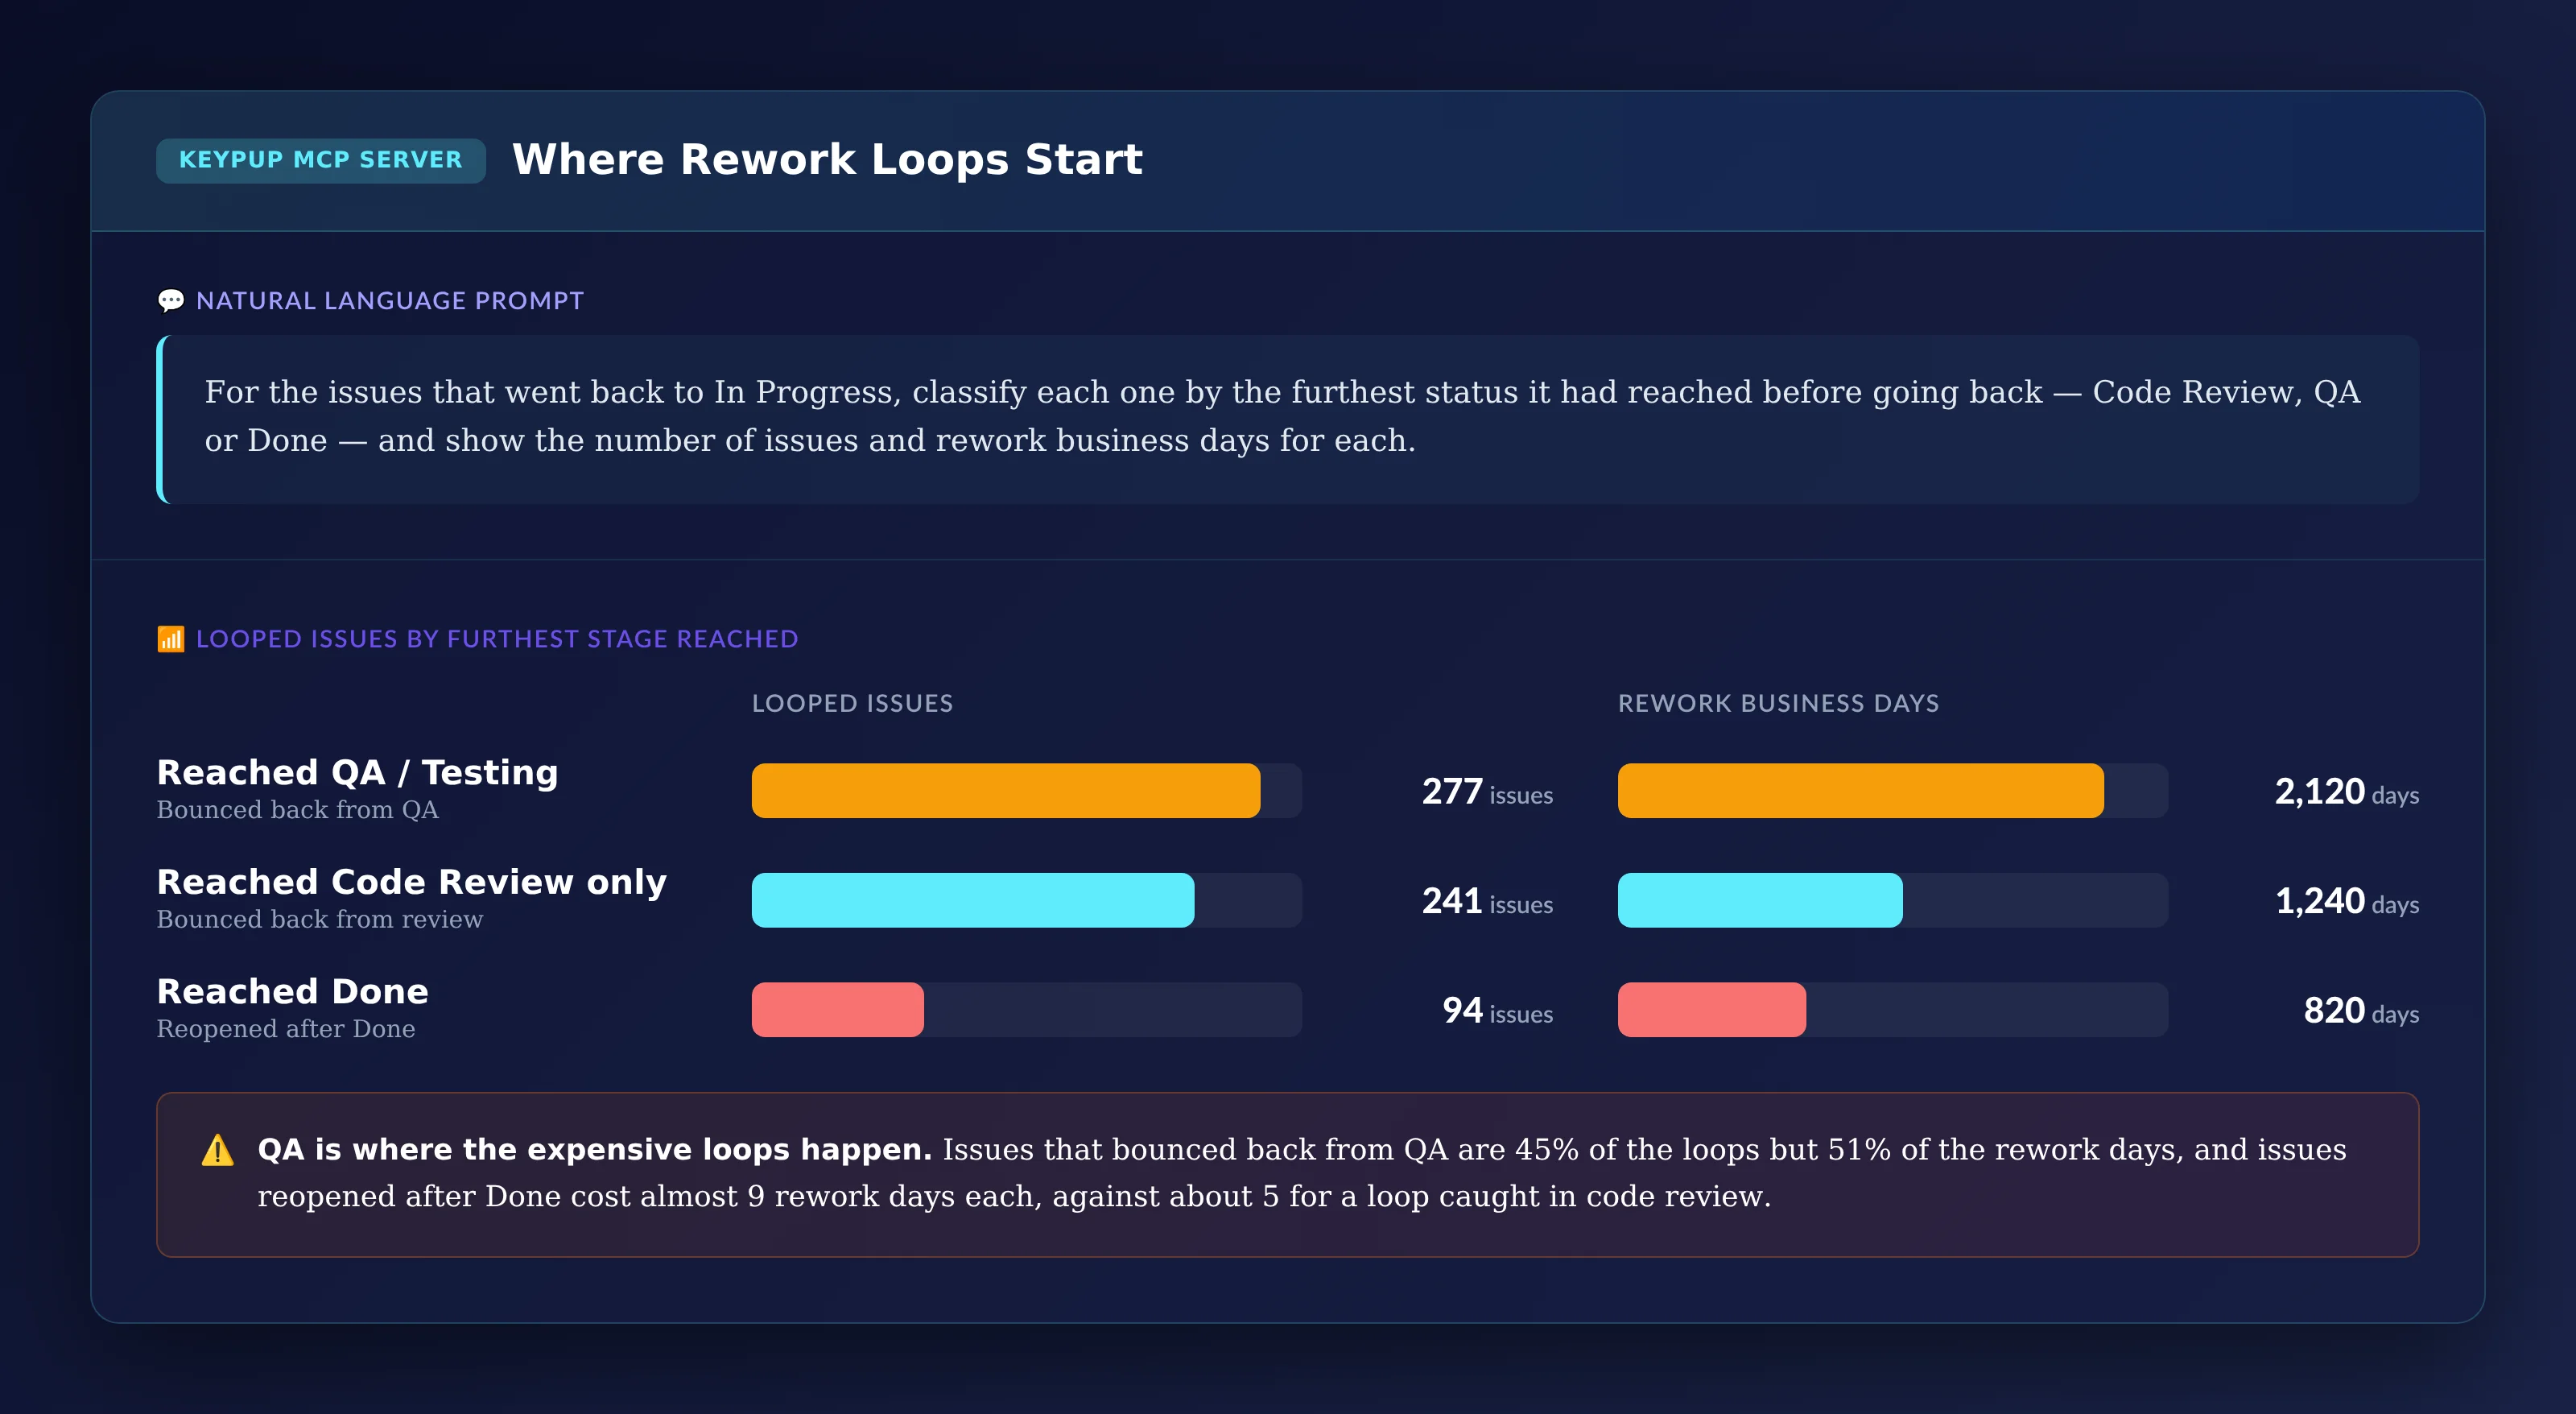
For the issues that went back to In Progress, classify each
one by the furthest status it had reached before going back —
Code Review, QA or Done — and show the number of issues and
rework business days for each.
Output: Where Rework Loops Start
Key Insight: QA is where the expensive loops happen. Issues that bounced back from QA are 45% of the loops but 51% of the rework days, and issues reopened after Done cost almost 9 rework days each, against about 5 for a loop caught in code review. The later a problem is caught, the more it costs — so the goal is to catch issues earlier, not to test harder at the end.
3. Proving Whether Rework Is Growing
Leadership needs to know whether the loop rate is a stable cost or a worsening trend.
MCP Prompt:
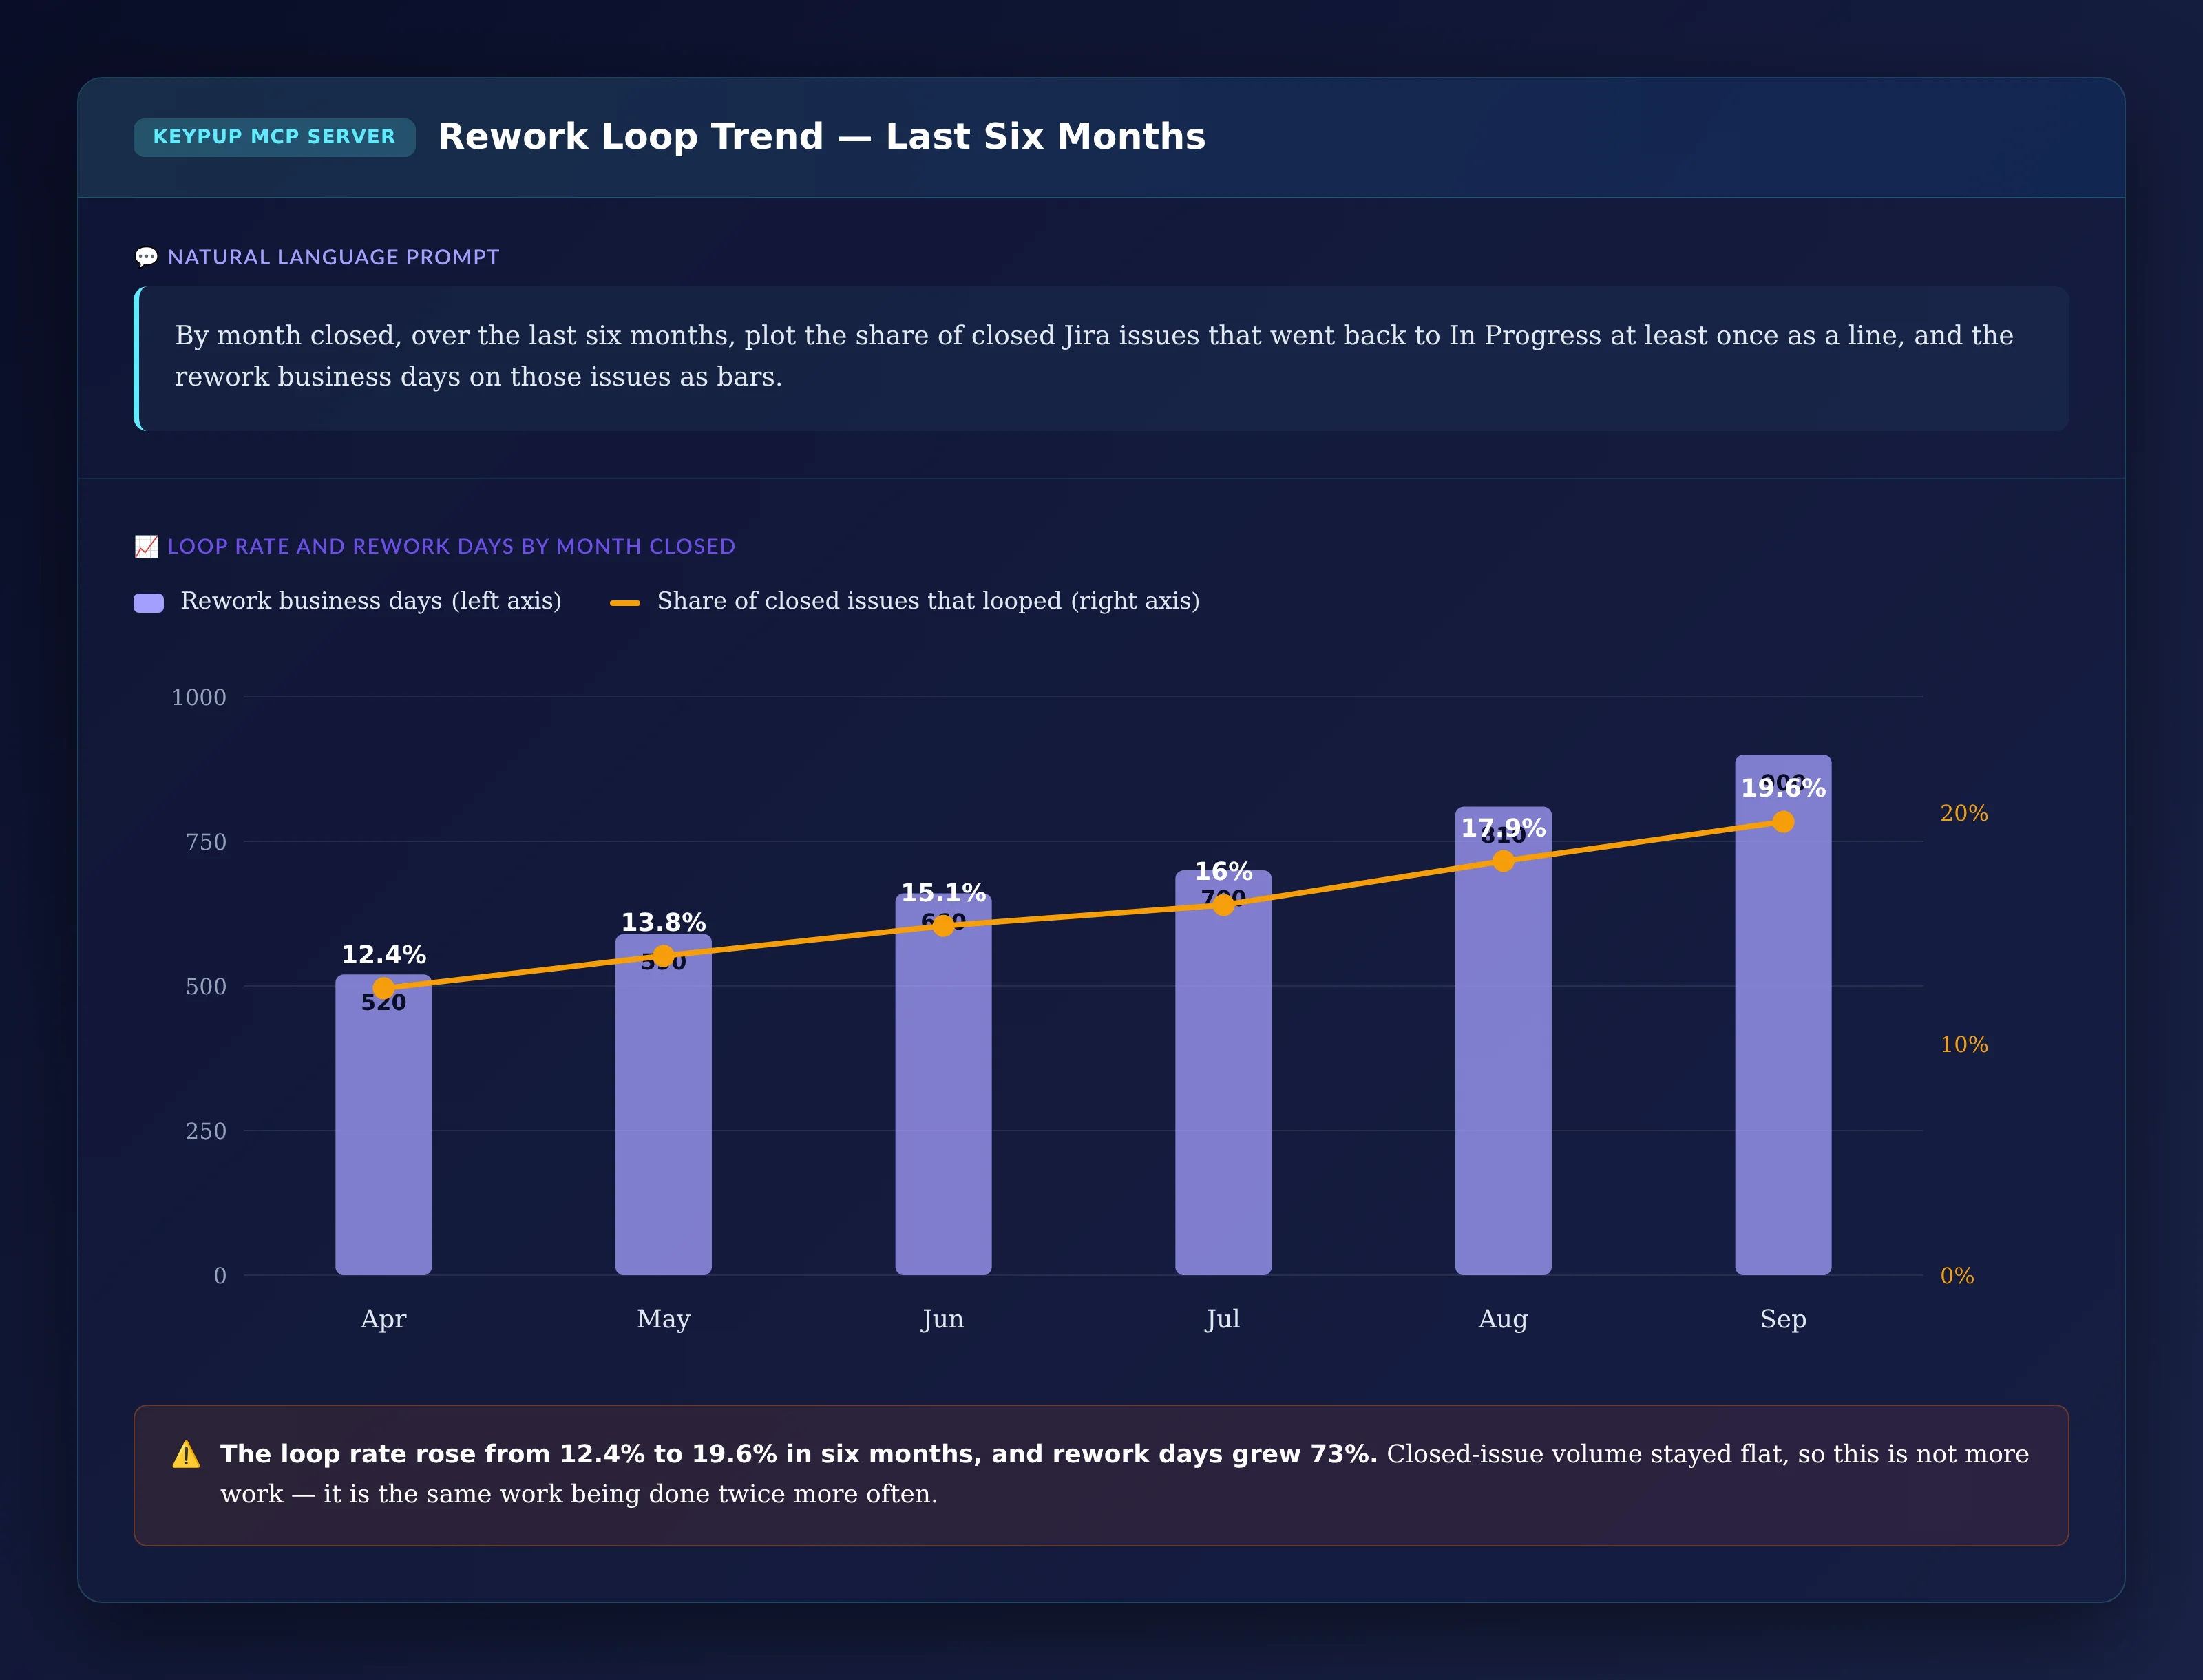
By month closed, over the last six months, plot the share of
closed Jira issues that went back to In Progress at least once
as a line, and the rework business days on those issues as bars.
Output: Rework Loop Trend — Last Six Months
Key Insight: The loop rate rose from 12.4% to 19.6% in six months, and monthly rework days grew 73%. Closed-issue volume stayed flat, so this isn't more work — it's the same work being done twice more often. A trend like this usually follows a change upstream: a new team, a new codebase, or looser acceptance criteria.
4. Measuring the Cycle Time Cost of a Single Loop
To make the case for fixing loops, leaders need to show what a single loop costs in delivery time.
MCP Prompt:
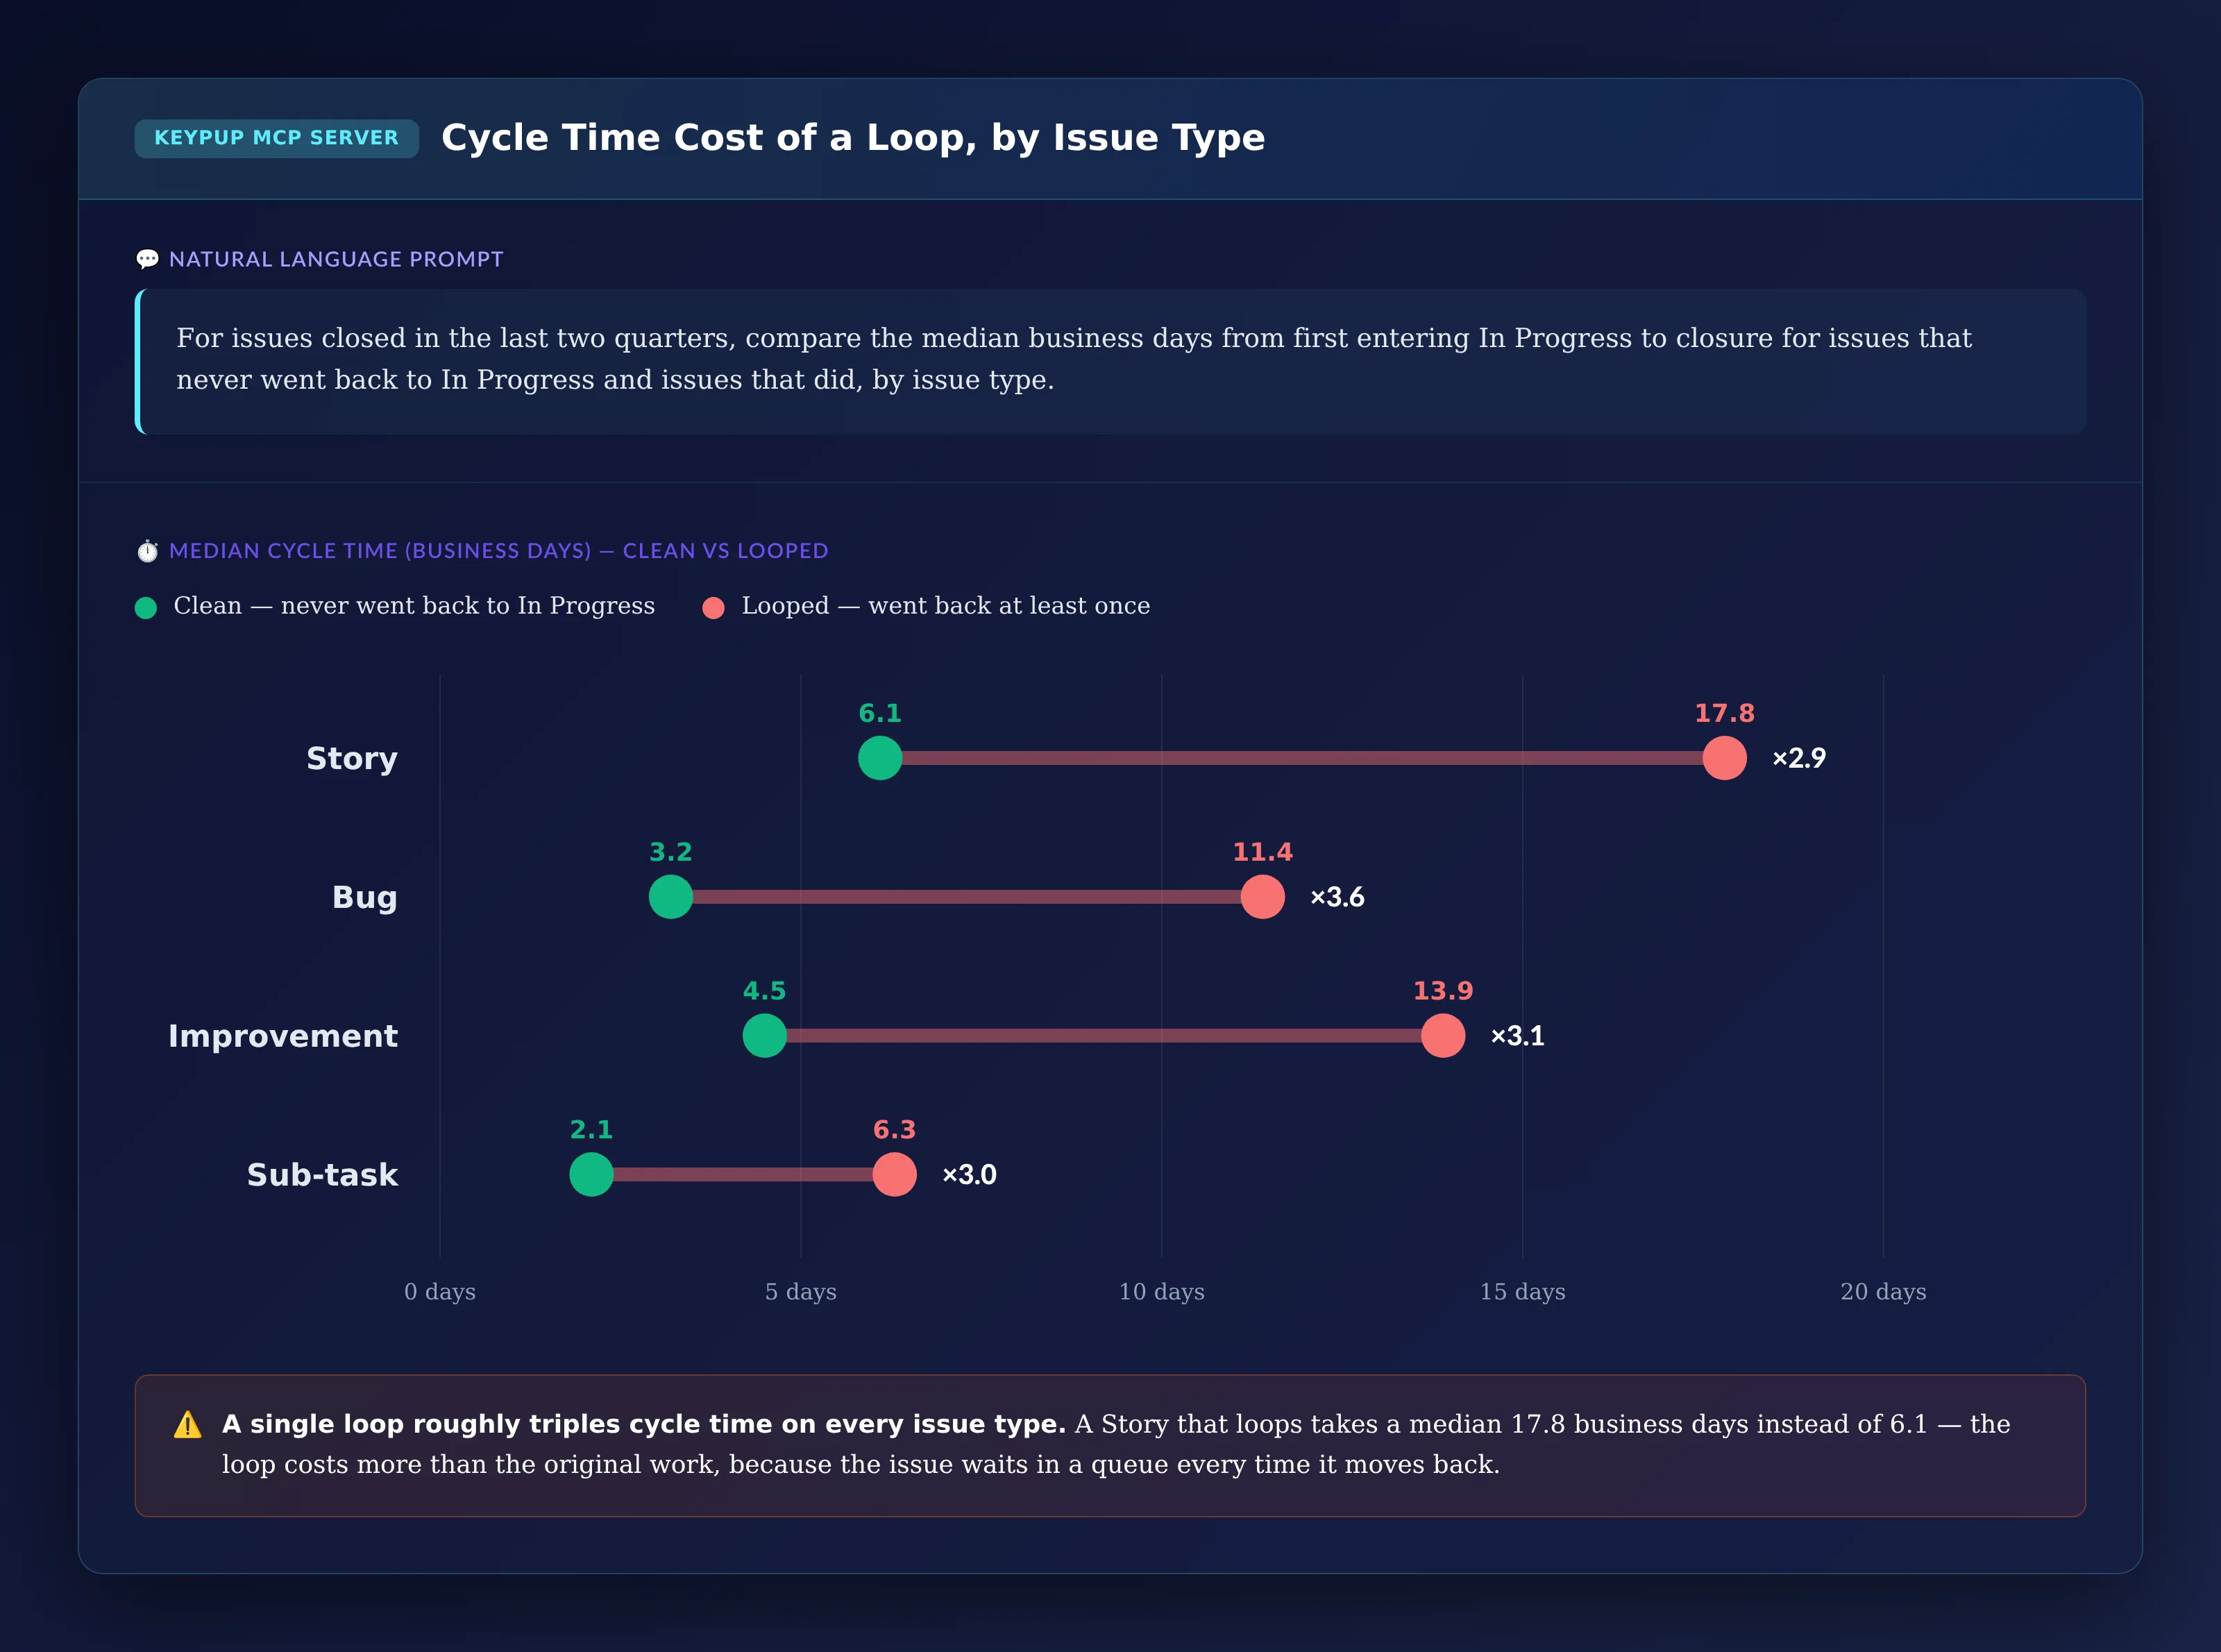
For issues closed in the last two quarters, compare the median
business days from first entering In Progress to closure for
issues that never went back to In Progress and issues that did,
by issue type.
Output: Cycle Time Cost of a Loop, by Issue Type
Key Insight: A single loop roughly triples cycle time on every issue type. A Story that loops takes a median 17.8 business days instead of 6.1 — the loop costs more than the original work, because the ticket waits in a queue every time it moves back. Cutting the loop rate is often the fastest way to cut cycle time without asking anyone to work faster.
5. Connecting Loops to Change Size and Teams
Is ping-pong a team problem or a work-shape problem? Lines changed in linked pull requests and the Jira Team field answer it together.
MCP Prompt:
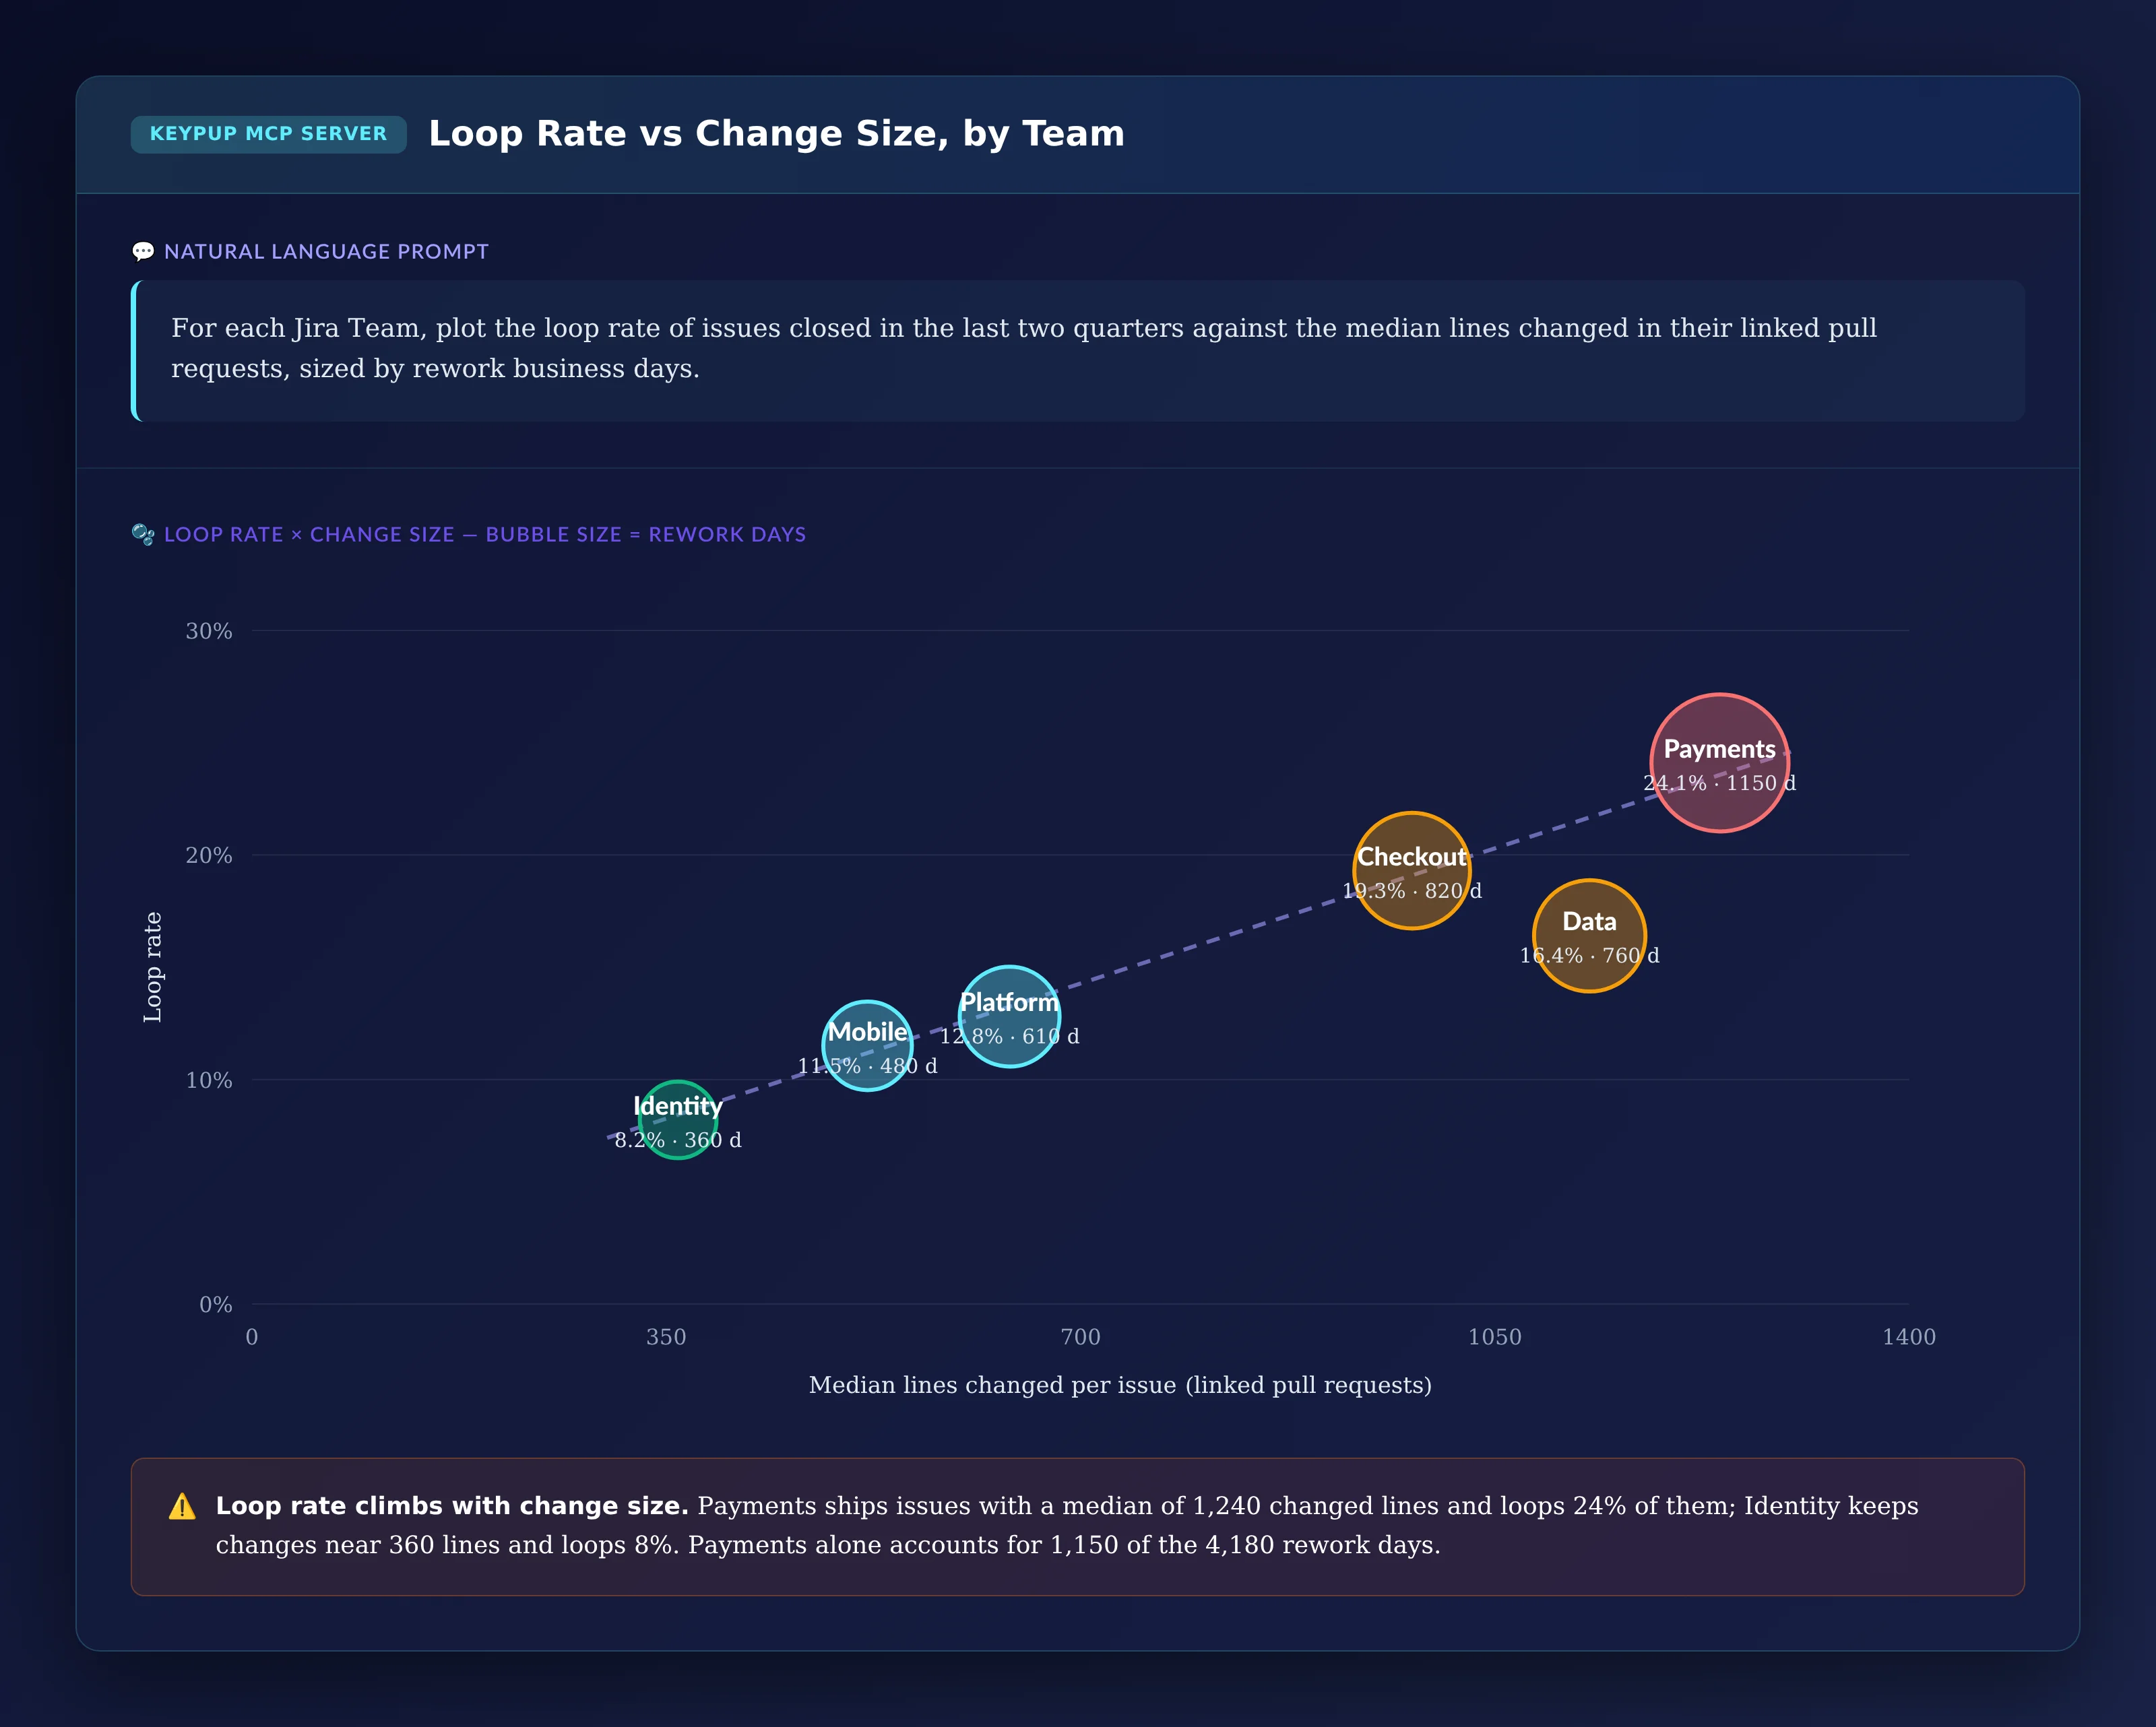
For each Jira Team, plot the loop rate of issues closed in the
last two quarters against the median lines changed in their
linked pull requests, sized by rework business days.
Output: Loop Rate vs Change Size, by Team
Key Insight: Loop rate climbs with change size. Payments ships issues with a median of 1,240 changed lines and loops 24% of them; Identity keeps changes near 360 lines and loops 8%. Payments alone accounts for 1,150 of the 4,180 rework days. That points to one targeted fix — smaller, more frequent changes on two or three teams — rather than an organization-wide QA mandate.
6. Getting the List of Repeat Loopers
For the retrospective, leads need the specific tickets that looped the most, with enough context to see why.
MCP Prompt:
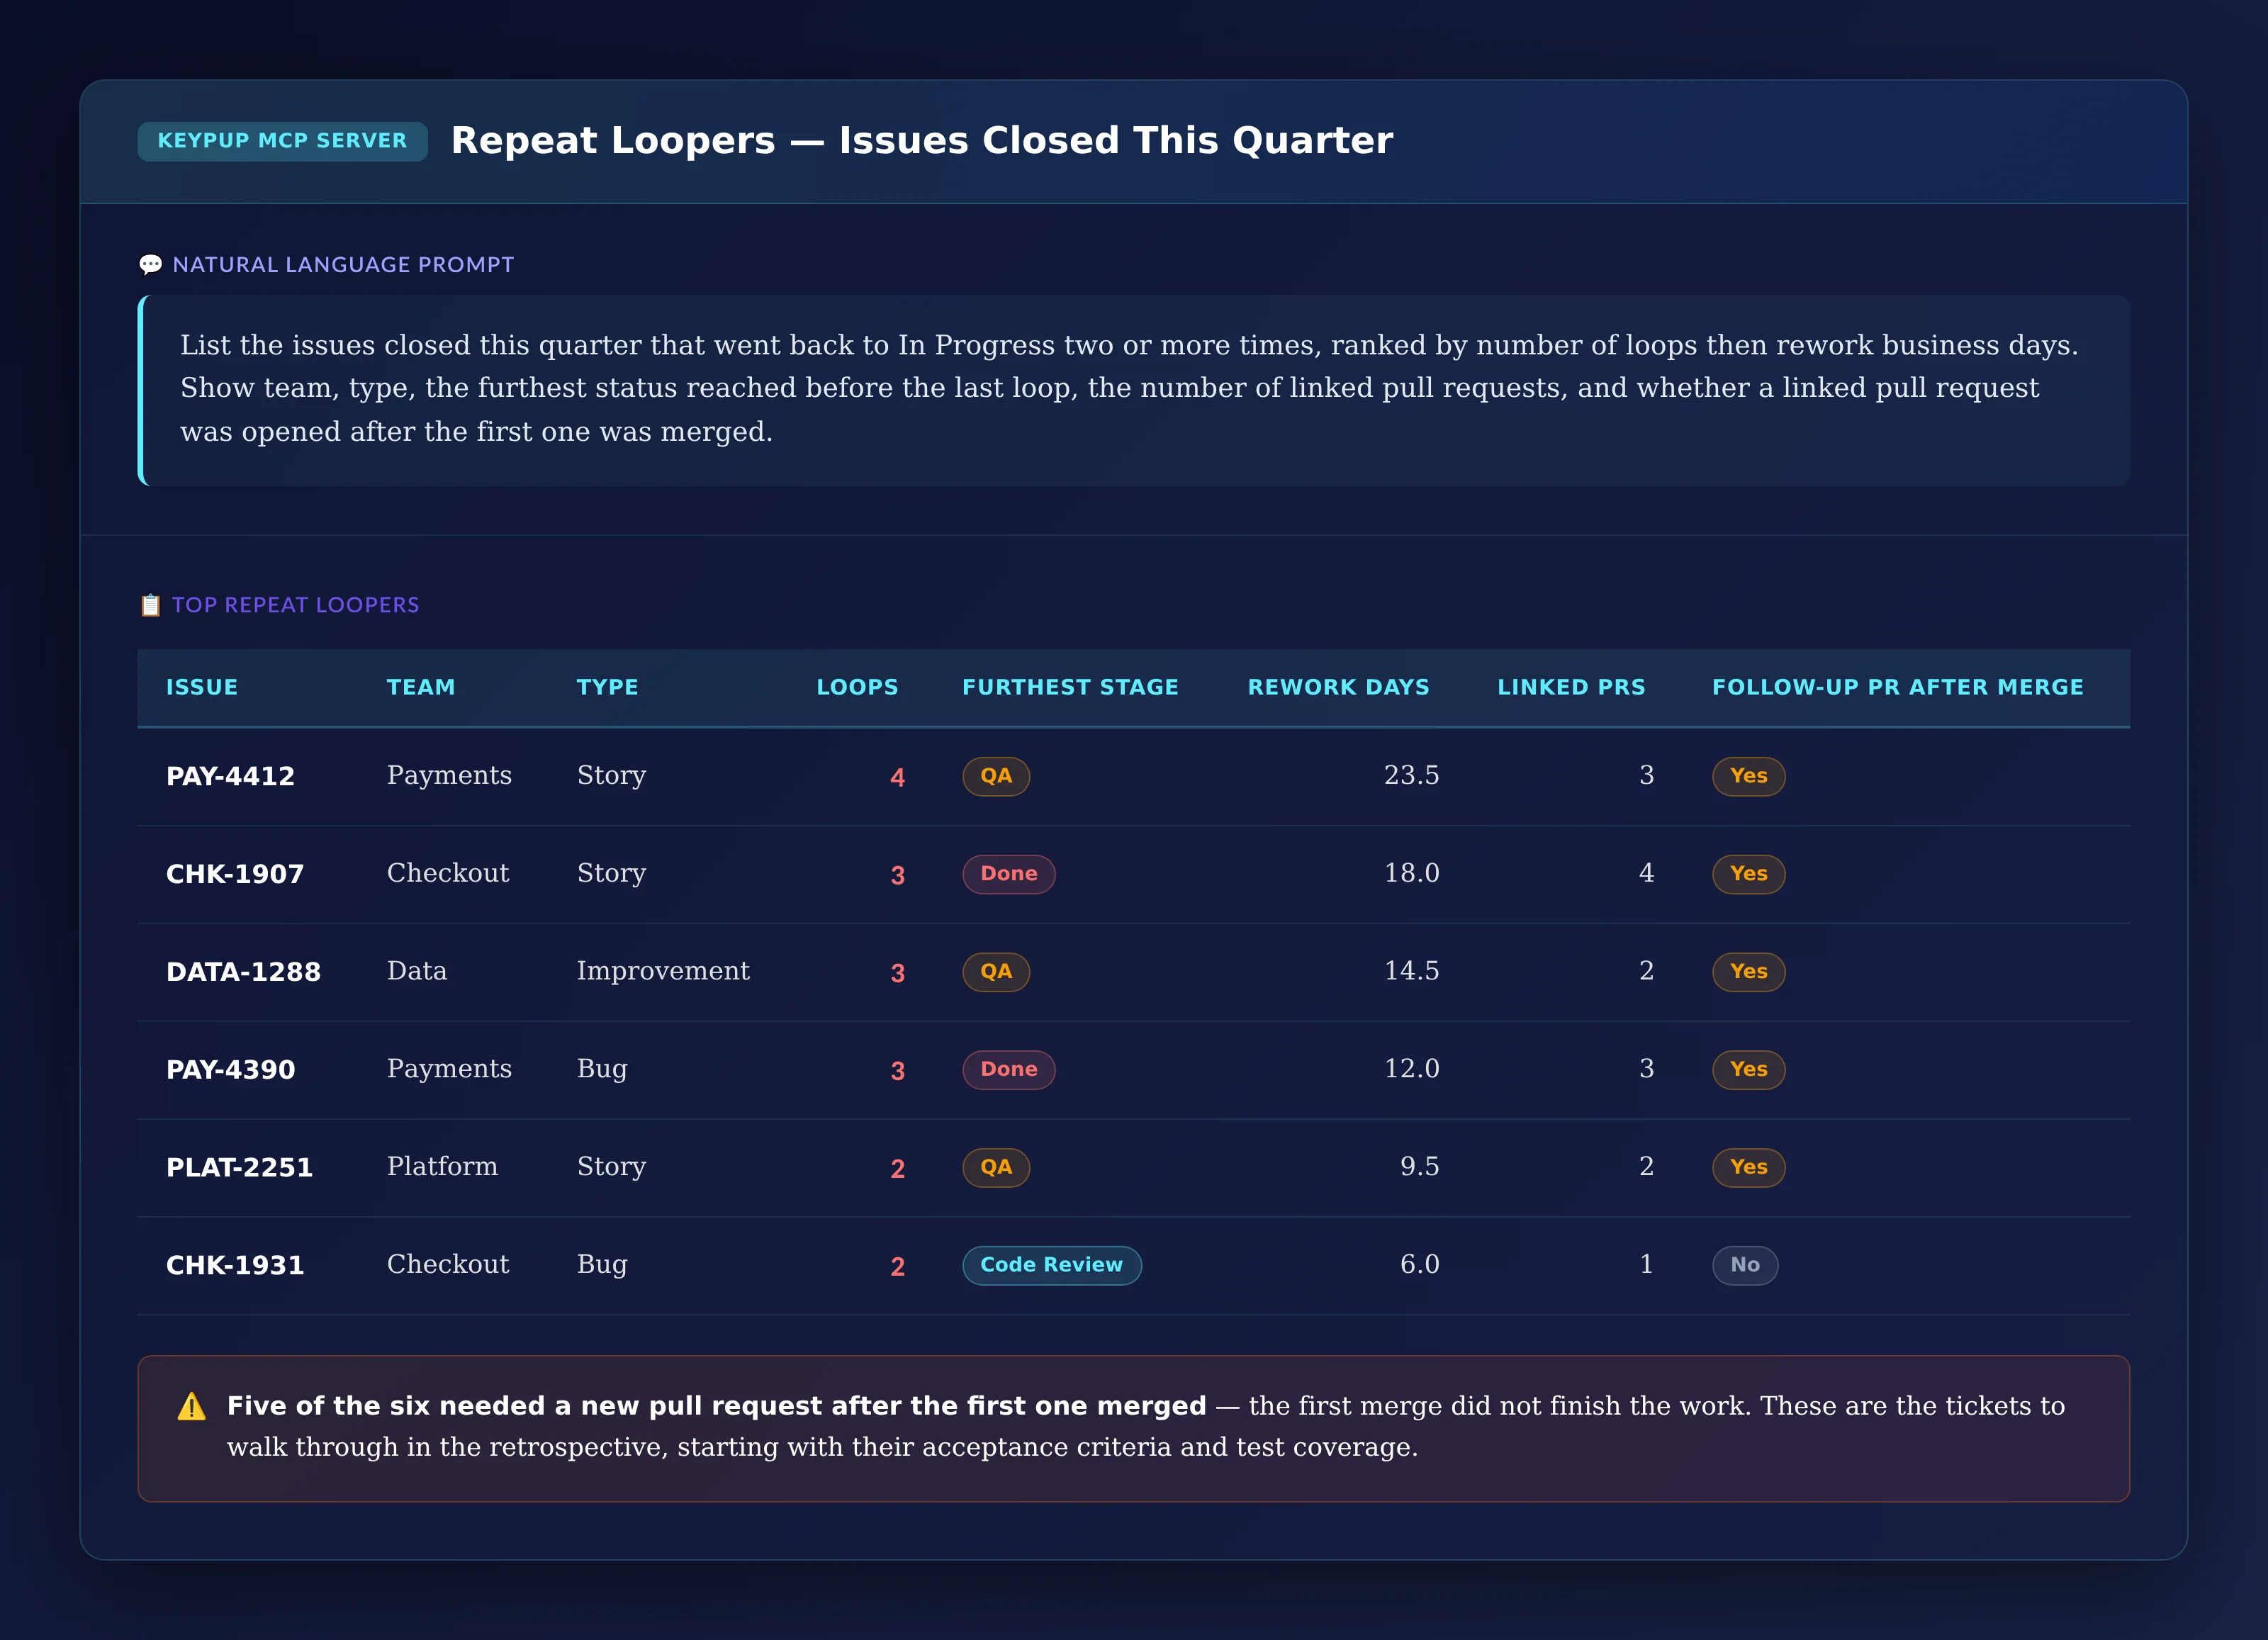
List the issues closed this quarter that went back to In
Progress two or more times, ranked by number of loops then
rework business days. Show team, type, the furthest status
reached before the last loop, the number of linked pull
requests, and whether a linked pull request was opened after
the first one was merged.
Output: Repeat Loopers — Issues Closed This Quarter
Issue
Team
Type
Loops
Furthest Stage
Rework Days
Linked PRs
Follow-up PR After Merge
PAY-4412
Payments
Story
4
QA
23.5
3
Yes
CHK-1907
Checkout
Story
3
Done
18.0
4
Yes
DATA-1288
Data
Improvement
3
QA
14.5
2
Yes
PAY-4390
Payments
Bug
3
Done
12.0
3
Yes
PLAT-2251
Platform
Story
2
QA
9.5
2
Yes
CHK-1931
Checkout
Bug
2
Code Review
6.0
1
No
Key Insight: Five of the six needed a new pull request after the first one merged — the first merge did not finish the work, and each of them went back to In Progress at least twice. These are the tickets to walk through in the retrospective, and the questions to ask are about acceptance criteria and test coverage, not about who wrote the code.
The Technical Implementation: What Keypup MCP Actually Reads
Every number above comes from data Keypup already imports from Jira and your Git platform. It helps to be precise about what that data is — and what it isn't.
Loops Come From the Jira Workflow Timeline
For every Jira issue, Keypup stores a workflow timeline: each status the issue entered, in order, with the time it entered and left it. An issue that entered "In Progress" again after leaving it has looped. Comparing the first time it entered QA or Done with the last time it entered In Progress shows how far it got before going back. Keypup also computes how long an issue spent in a given status, in calendar time or in business days.
Your Status Names Define the Stages
The prompts use status names such as "In Progress," "Code Review," "QA" and "Done." Keypup reads your statuses as your teams named them, so the prompts need to use your workflow's names — for example "In Testing" or "UAT" instead of "QA." If a team's workflow has no separate review or QA status, the stage breakdown in prompt 2 can only separate "before Done" from "after Done" for that team.
How Rework Days Are Defined
Rework days are the business days an issue spent in In Progress, minus the business days of its first In Progress stretch. This counts active development on second and later passes. It does not include time waiting in review or QA queues on those passes, so the real cost of each loop is higher than the rework figure.
Cycle Time Starts at First In Progress
The cycle times in prompt 4 run from the first time an issue entered In Progress to the time it was closed, in business days. Issues that never entered In Progress are excluded.
Team and Change Size Depend on Fields and Linking
Grouping by team uses your Jira Team field (or whichever custom field you use to assign issues to teams), so the team view only works if that field is filled in consistently. Change size uses the lines changed in the pull requests linked to each issue, and the follow-up pull request check compares the creation dates and first merge date of those linked pull requests. Both depend on your engineers referencing Jira issue keys in their pull requests; issues without a linked pull request have no change size and are left out of those views.
Real-World Impact: Enterprise Case Studies
Case Study 1: Global Payments Processor
Before Keypup MCP:
Fourteen teams reported stable velocity while median cycle time crept up for three quarters
QA leadership requested more testers, and engineering leadership questioned QA's rejection rate; neither had data
Retrospectives discussed individual "difficult tickets" with no view of how common loops were
After Keypup MCP:
The loop rate was reported per team every month alongside cycle time, showing that a sixth of closed work went backward at least once
The stage breakdown showed most expensive loops started in QA, so teams added a short acceptance-criteria review with QA before development started
Loop rate fell from 18% to 9% in two quarters, and median cycle time on Stories dropped by a third — with no additional QA headcount
"We were about to hire six more testers. The data showed our testers were catching the problems fine — they were just catching them too late, on tickets that should never have started without clear acceptance criteria. Fixing that cost us nothing."
— VP Engineering, Global Payments Processor
Case Study 2: Enterprise Healthcare Software Vendor
Before Keypup MCP:
Tickets reopened after Done were moved back to In Progress and closed again, counted once in velocity, so delivery looked strong while the same stories were being reworked
Two teams consistently delivered late, and leadership assumed a skills gap
No one could connect late delivery to change size or review practice
After Keypup MCP:
The change-size view showed the two late teams shipped issues with three times the median lines changed of other teams, and looped at twice the rate
The teams adopted a split-before-start rule for any ticket expected to touch more than a few hundred lines
Reopened-after-Done issues fell by half within a quarter, and the two teams' cycle time came back in line with the rest of the organization
"We thought we had two weak teams. We actually had two teams shipping huge changes that bounced every time. Once we could see the loop rate next to change size, the fix was about how the work was shaped, not who was doing it."
— Director of Engineering, Enterprise Healthcare Software Vendor
Implementation: Getting Started with Keypup MCP
1. Connect Jira and Your Git Platform
Connect Jira and GitHub, GitLab or Bitbucket to Keypup. Workflow status histories, issue types, custom fields and pull request links are imported automatically.
2. Map Your Workflow Statuses
List the status names your teams use for development, review, QA and done. Use those exact names in your prompts so loops and stages are detected correctly for each workflow.
3. Check Your Field and Linking Hygiene
Confirm your teams fill in the Team field and that pull requests reference Jira issue keys. These two habits decide how precise the team and change-size views can be.
4. Connect the MCP Server to Your AI Assistant
Follow the MCP documentation to connect Keypup to Claude, ChatGPT, Cursor or any MCP-compatible assistant.
5. Establish Your Baseline and Make It a Ritual
Run the sizing and trend prompts for the last two quarters to set a baseline. Then bring the repeat-looper list to every retrospective and the monthly loop rate to every delivery review, so loops get addressed while they are still a pattern and not yet a culture.
Frequently Asked Questions
What is QA ping-pong in software development?
QA ping-pong is when a ticket moves back and forth between development and QA (or code review) several times before it is accepted. Each round trip adds rework and queue time, often tripling the ticket's cycle time.
How do you measure rework loops in Jira?
Read each issue's workflow status history and count the issues that re-entered "In Progress" after leaving it. The share of closed issues that did so is the loop rate; the business days spent in In Progress after the first pass is the rework cost. Keypup MCP computes both from the Jira workflow timeline.
What is a good loop rate?
There is no universal benchmark, and it depends on how your workflow is designed. The most useful measures are your own trend over time and the difference between teams. A rising loop rate, or one team looping at twice the rate of others, is the signal to investigate.
Does reducing QA ping-pong require more testers?
Usually not. Most expensive loops come from problems that could have been caught earlier — unclear acceptance criteria, oversized changes, or missing tests before review. Measuring where loops start shows which fix applies.
The Bottom Line
QA ping-pong is one of the largest hidden costs in enterprise delivery, and one of the least measured. Keypup MCP turns it into numbers every leader can act on:
✅ Sizing the rework loop problem — loop rate, reopened-after-Done count and rework days ✅ Finding where loops start — code review, QA or after Done ✅ Tracking whether rework is growing, month over month ✅ Measuring the cycle time cost of a single loop, by issue type ✅ Connecting loops to change size and teams, so fixes are targeted ✅ Listing repeat loopers for every retrospective
When leaders can see how much work is done twice, they stop buying more capacity and start fixing the loop.
Get Started
Ready to see how much of your team's work is being done twice?
Start Free Trial — Connect Jira and your Git platform in minutes and measure your rework loop rate today.
Request Demo — See how enterprise engineering leaders use Keypup MCP to turn QA bounce-back into a measurable, fixable metric.
View MCP Documentation — Technical details for engineering teams connecting Keypup MCP to Jira and their Git platform.
Keywords: QA ping-pong, rework loops, ticket bounce-back, reopened tickets, Jira workflow status history, rework rate, cycle time, QA rejection rate, software delivery predictability, MCP server engineering analytics
Ready to Transform Your Analytics?
Join teams already using AI to make data-driven decisions faster than
ever.
Enterprise code freezes exist to protect regulated, revenue-critical systems during high-risk windows — but "emergency exception" approvals are quietly becoming the default way to bypass them. Discover what engineers on Reddit say about freeze exception sprawl, and how Keypup MCP reconciles every pull request merged during a freeze against its Jira change request and review trail to close the gap before an auditor finds it first.
Chronic sprint carryover quietly turns every enterprise roadmap date into a guess. Discover what engineering leaders on Reddit say about the say/do gap, why velocity charts hide it, and how Keypup MCP measures carryover across Jira sprints and linked pull requests to show where commitments break, why, and which teams need help first.
Compare the 6 best development analytics software platforms for 2026 — Keypup, LinearB, Jellyfish, Swarmia, Appfire Flow and Faros — across DORA Metrics tracking, engineering dashboards, Git-to-ticketing data integration, custom KPI configurability, AI capabilities, setup time and data security. Find out which engineering intelligence platform turns raw Git and Jira data into prescriptive, actionable insights for your team.