📌 Executive Summary (Key Takeaways):
- The SPACE framework is the industry standard for holistically measuring developer productivity, moving beyond simple lines of code to measure well-being, efficiency, and collaboration.
- Because SPACE is a theoretical model, engineering leaders struggle to operationalize it. The solution is mapping the framework's dimensions directly to your objective Jira and GitHub metadata.
- While Keypup offers an out-of-the-box SPACE Analytics Template, every engineering team is unique. Using Keypup’s Generative AI Agent allows you to tailor SPACE insights instantly using natural language queries.
In the quest to measure developer productivity, the industry has finally realized that "lines of code" and "number of commits" are terrible metrics. Enter the SPACE Framework.
Developed by researchers at GitHub, Microsoft, and the University of Victoria, the SPACE framework captures the reality of software engineering: it is a complex, collaborative, and highly cognitive process. But there is a massive problem: SPACE is highly theoretical.
How do you actually measure "Satisfaction"? How do you quantify "Collaboration"?
The secret lies in the metadata already sitting in your version control (GitHub) and project management (Jira) tools. In this guide, we will break down exactly how to map the 5 dimensions of SPACE to concrete data points—and how to use Keypup’s AI Agent to generate these complex insights instantly.
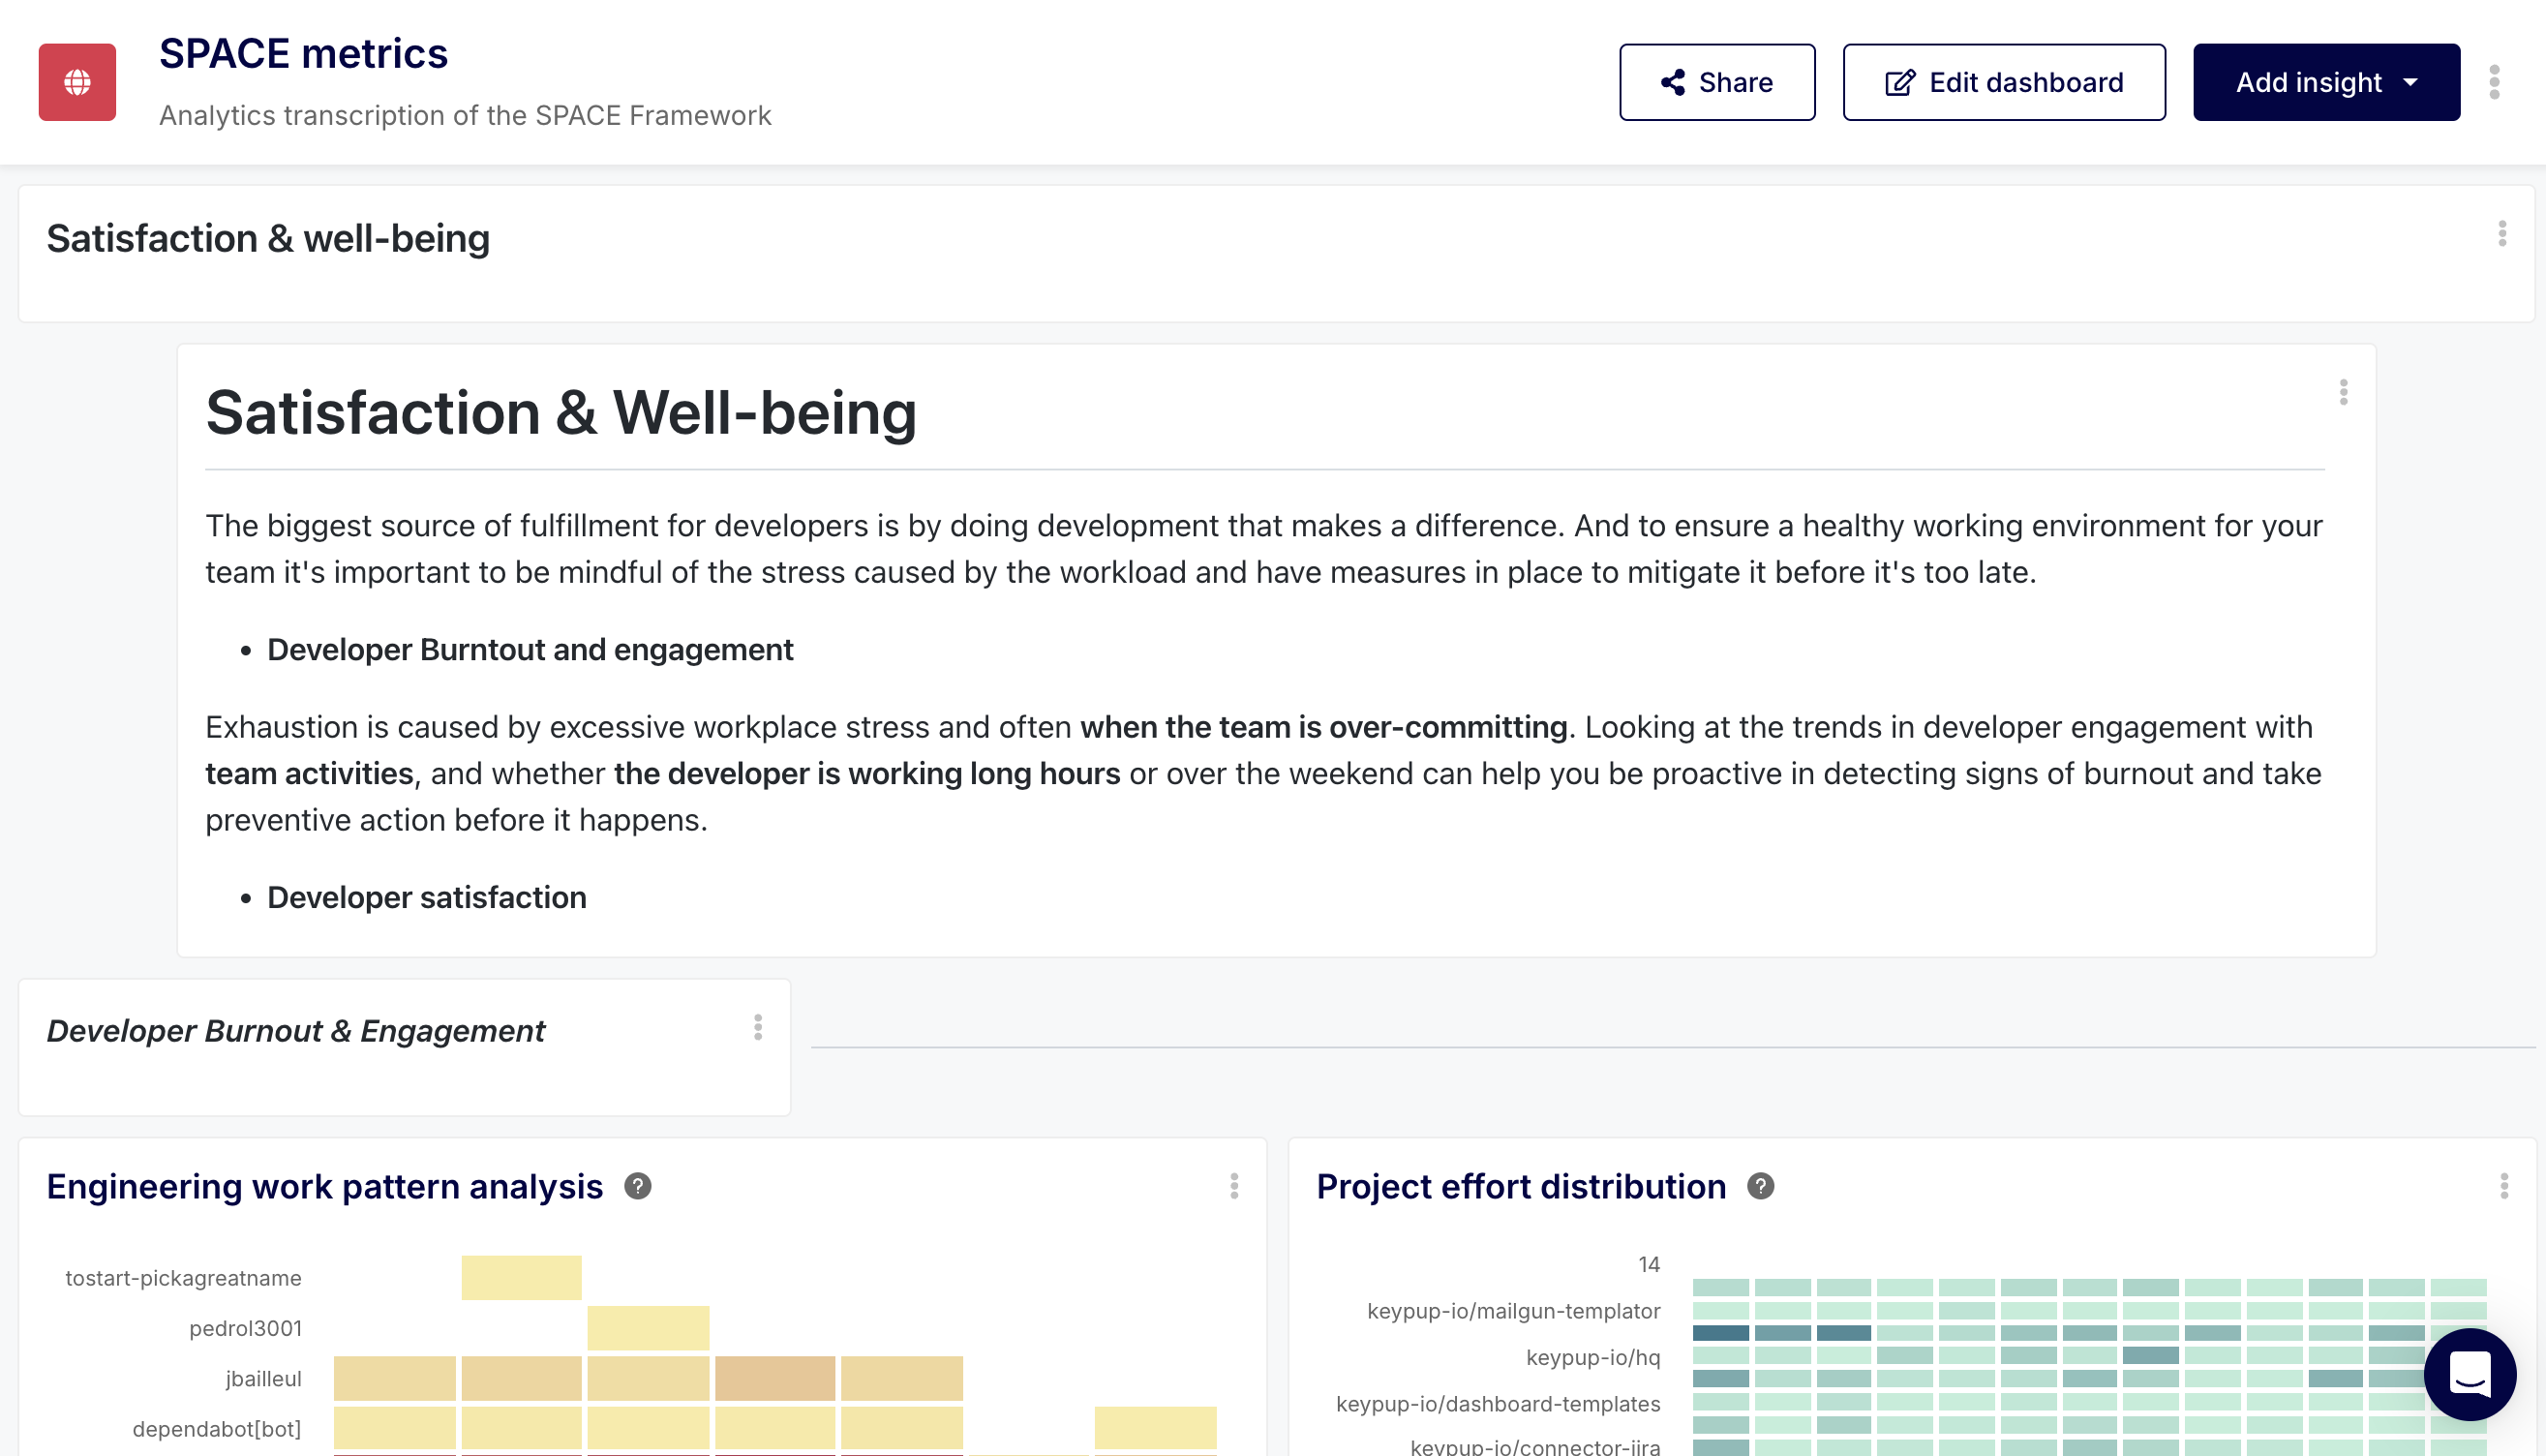
1. Satisfaction & Well-being (The Burnout Proxy)
Satisfaction is usually measured via qualitative developer surveys (e.g., eNPS). However, relying solely on quarterly surveys leaves you blind to real-time burnout. You must pair it with quantitative proxies extracted from Git and Jira.
The Data Mapping:
- After-Hours Commits: Tracking timestamps on GitHub commits to see who is routinely working weekends or late nights.
- Context Switching (WIP Limits): Counting how many Jira tickets a developer has in the "In Progress" column simultaneously. High context switching destroys satisfaction.
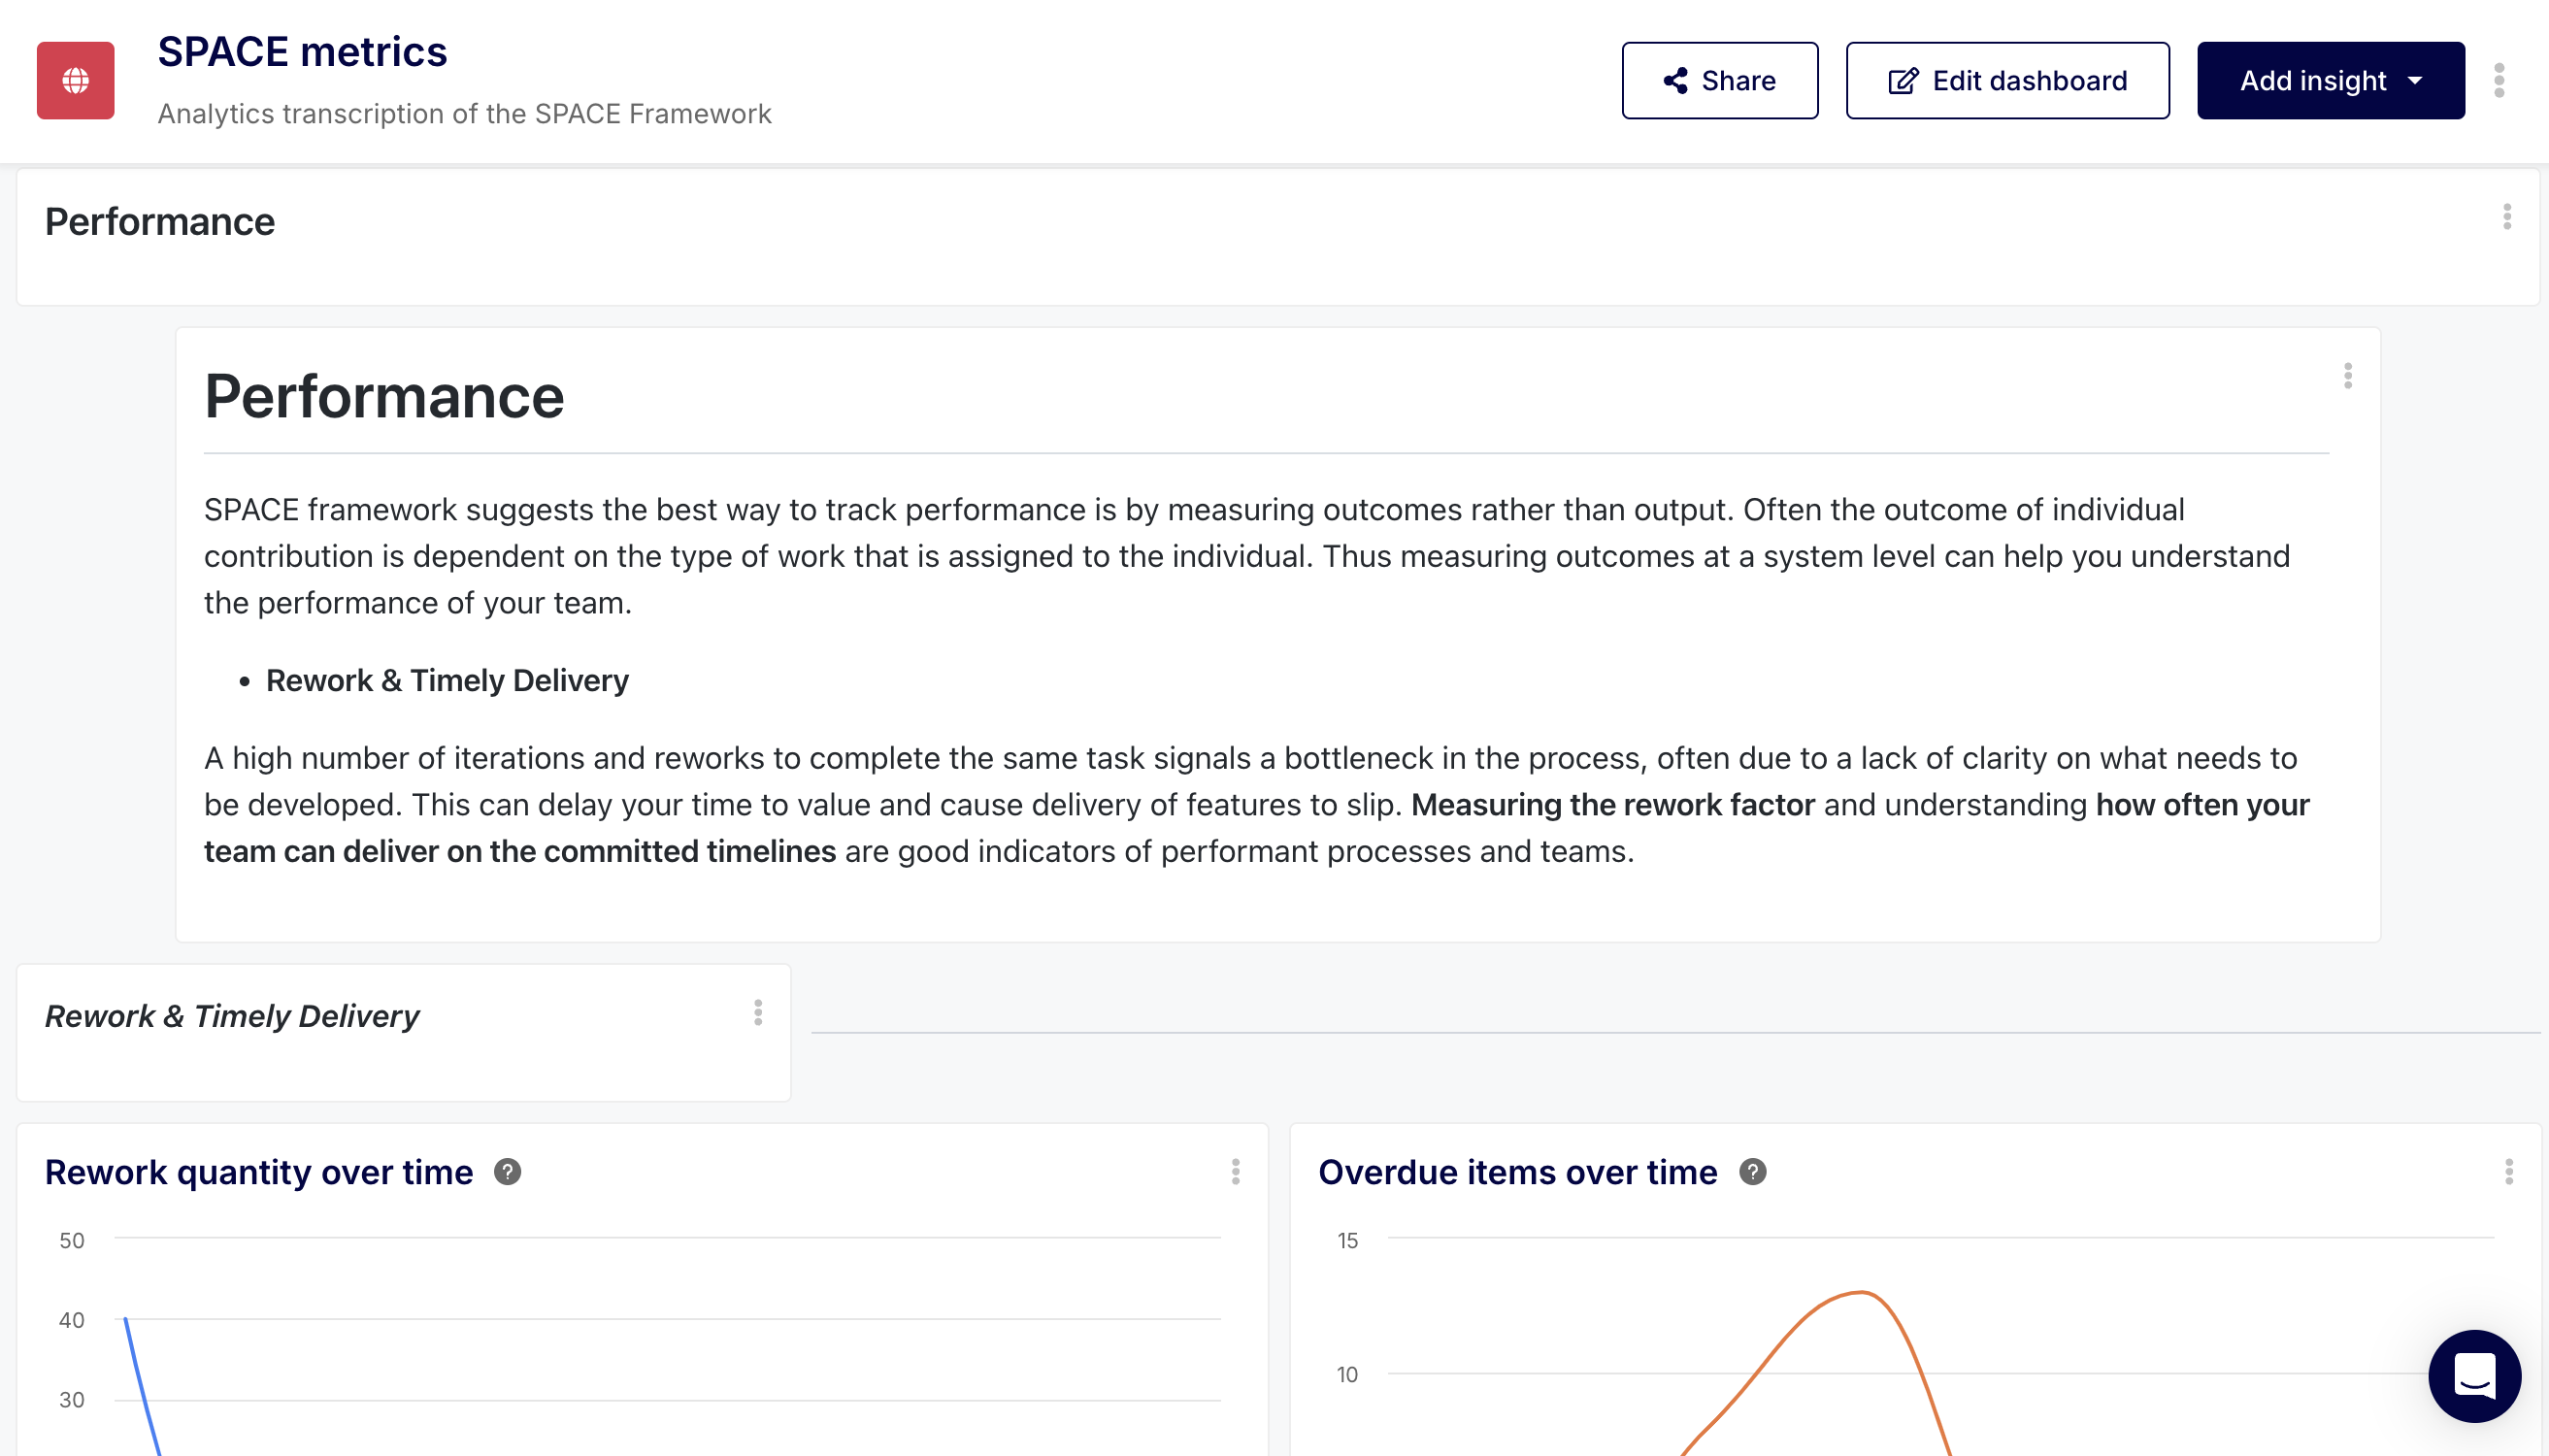
Performance measures the outcome of a system or process. It answers the question: "Is our code actually delivering value to the customer?"
The Data Mapping:
- Deployment Frequency (DORA): How often GitHub Actions successfully deploy code to production.
- Jira Epic Completion Rate: The percentage of planned Story Points actually transitioned to "Done" by the end of a sprint.
- Change Failure Rate: The percentage of Jira bugs logged immediately following a GitHub release.
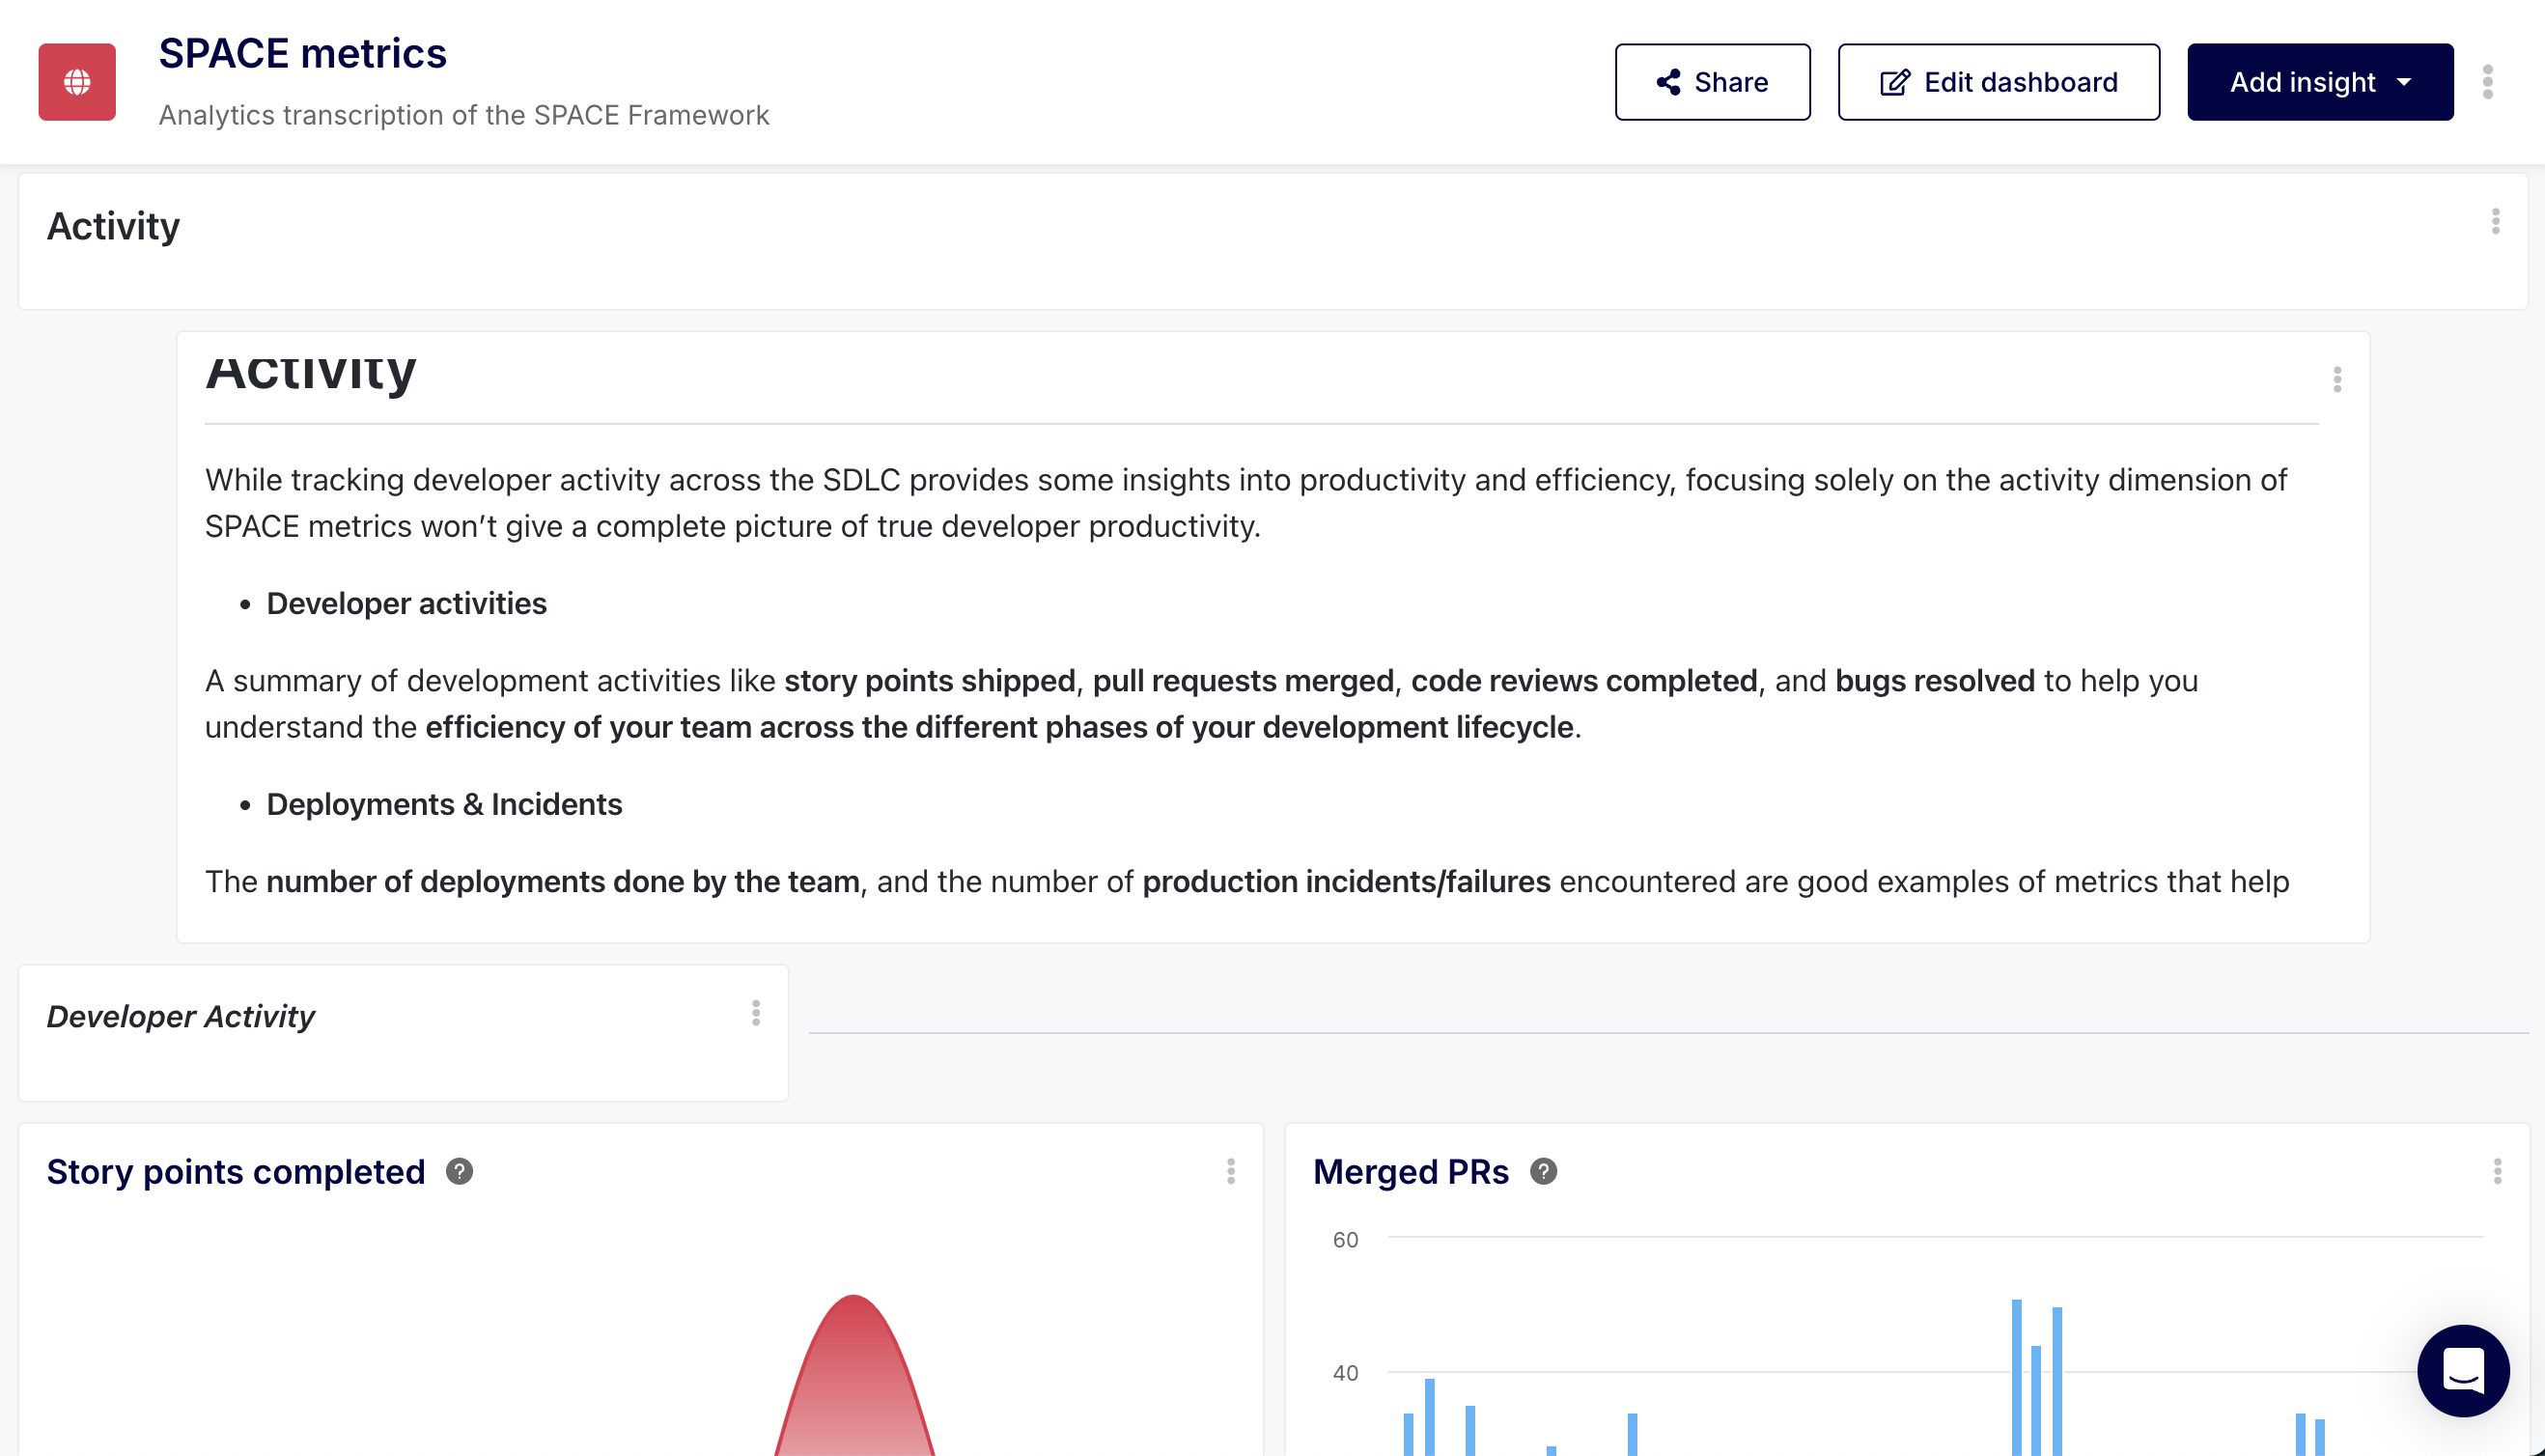
3. Activity (The Volume Metrics)
Activity is the easiest to measure but the most dangerous to use in isolation. It tracks the raw volume of work being done. In the SPACE framework, Activity should be used to spot anomalies, not to evaluate individual developers.
The Data Mapping:
- Pull Request Volume: The sheer number of PRs opened and merged.
- Issue Transition Count: How actively Jira boards are being updated.
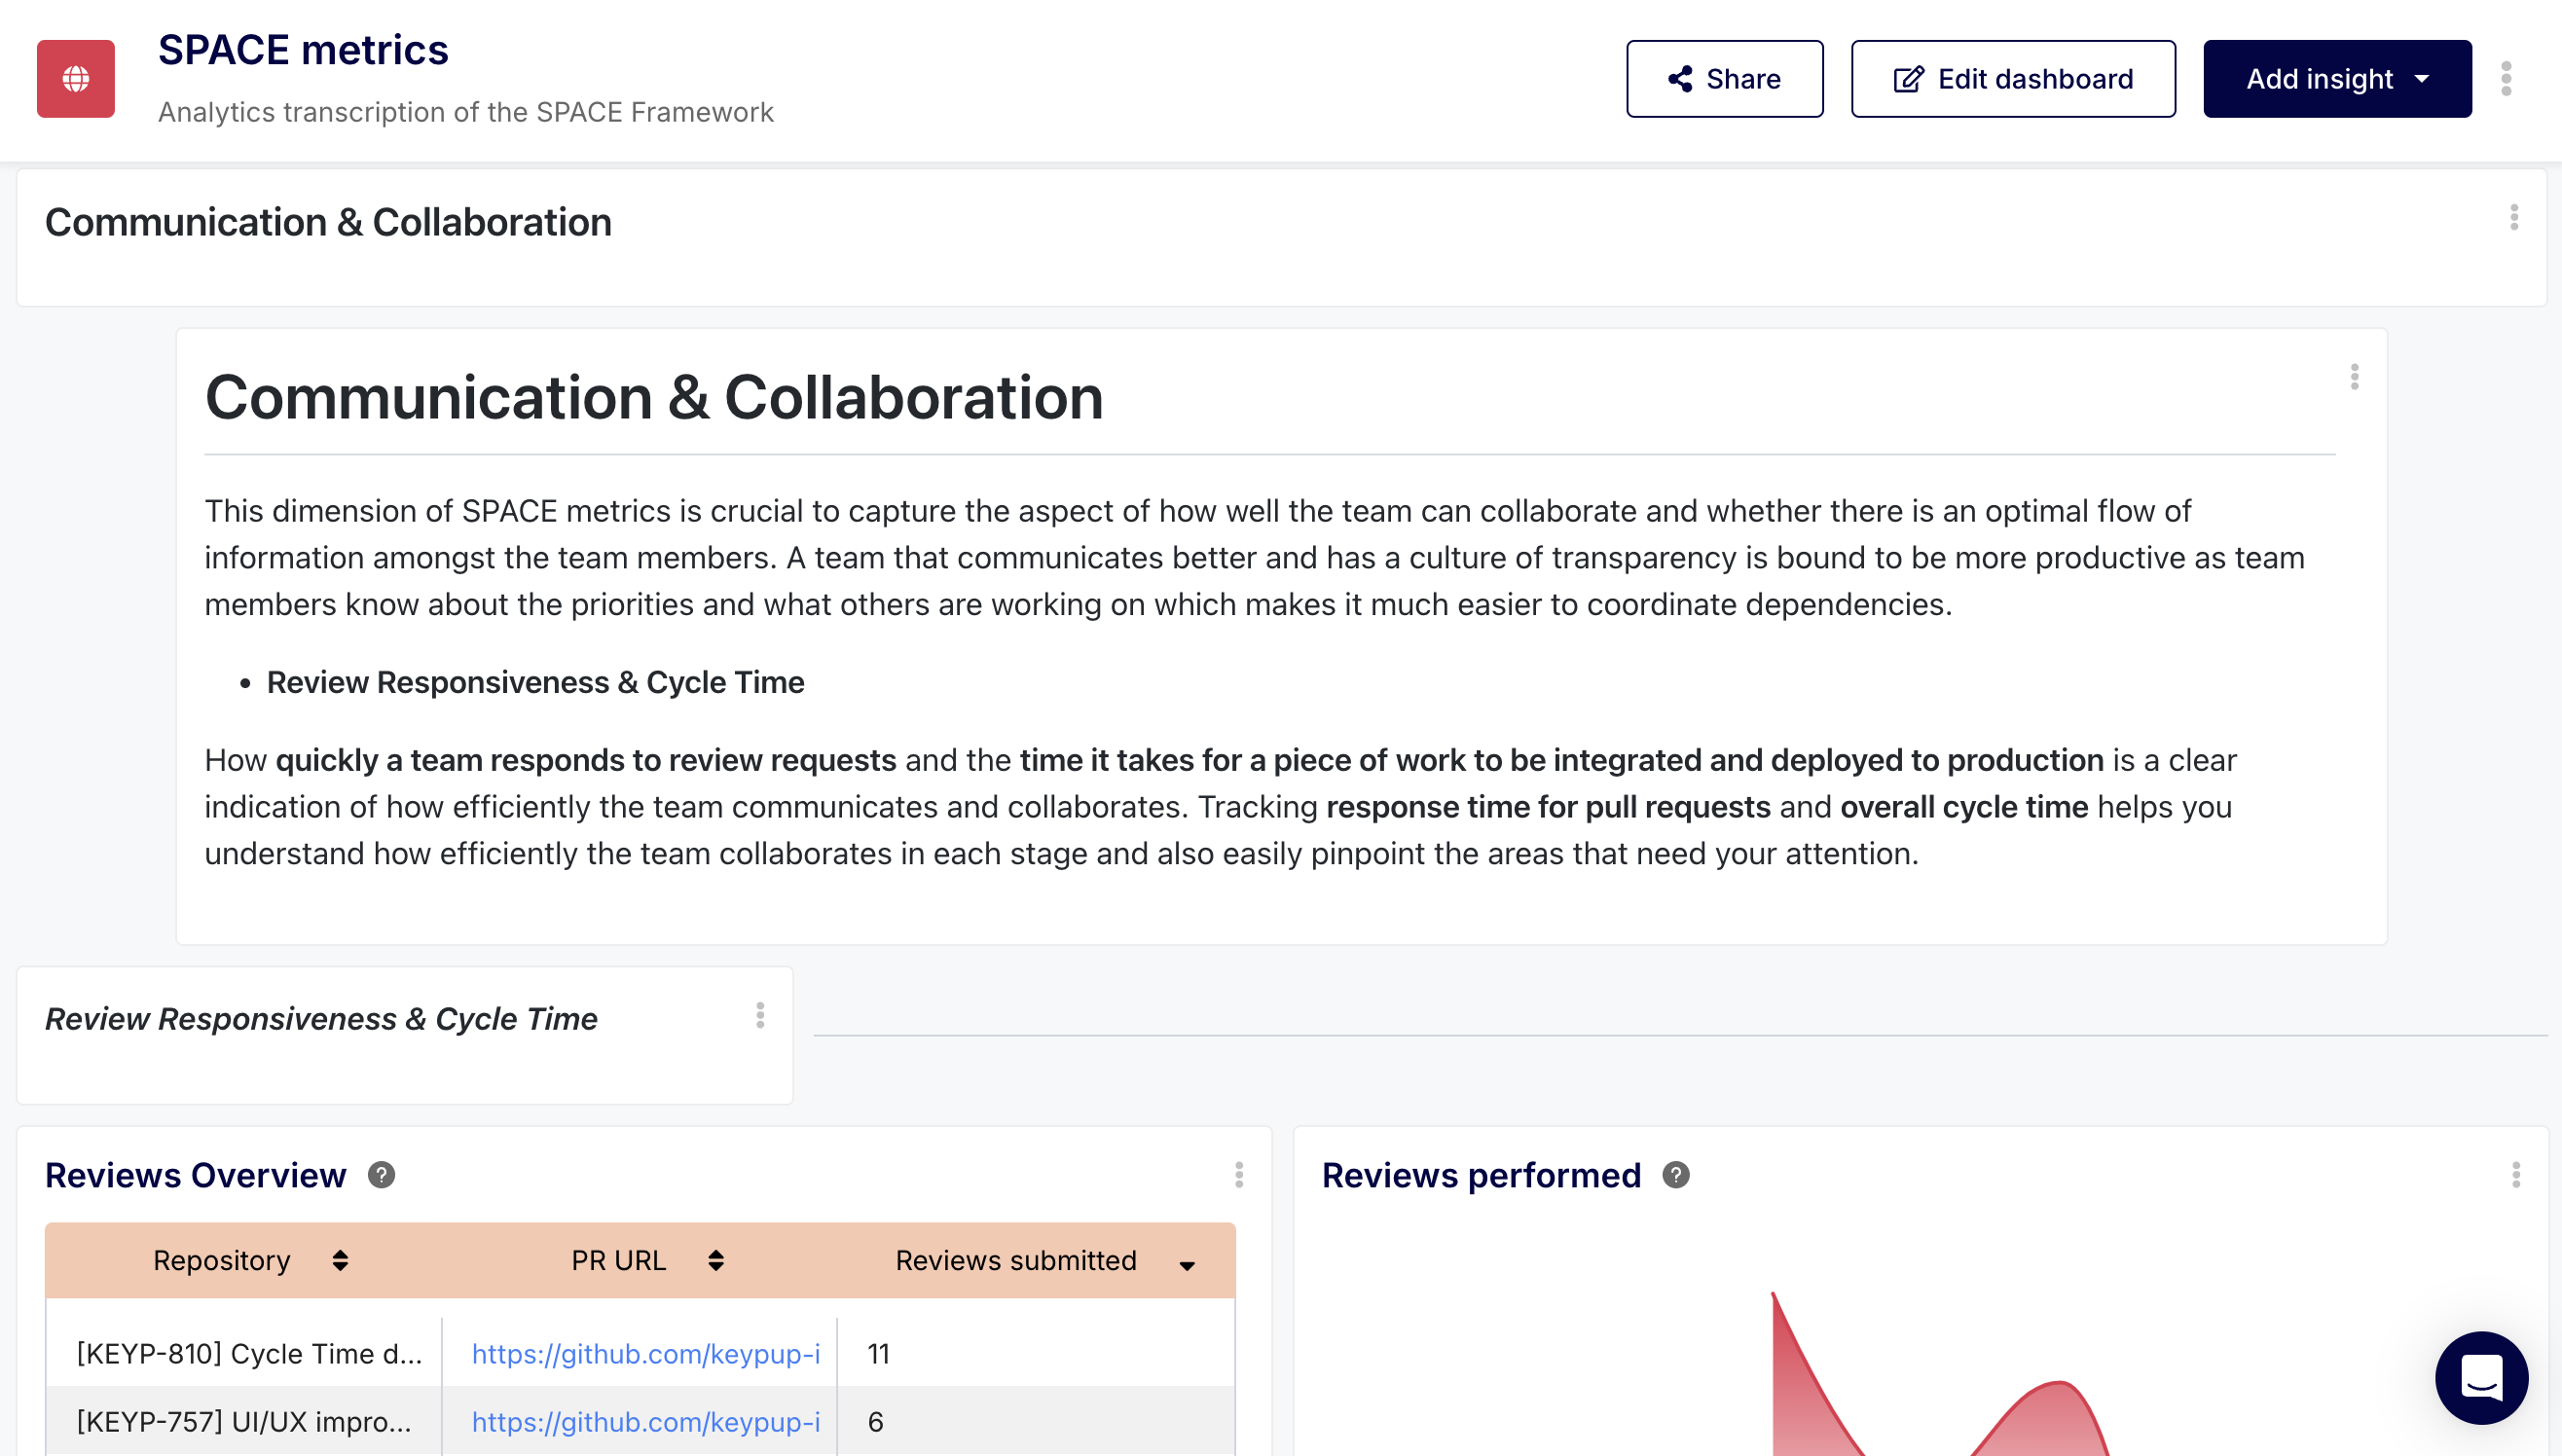
4. Communication & Collaboration (The Review Metrics)
Software is a team sport. If you only measure individual activity, you miss the invisible work of senior engineers who spend their days reviewing code and unblocking juniors.
The Data Mapping:
- Review Load: The number of PRs assigned to a specific engineer for review in GitHub.
- Time to First Review: How long a PR sits idle before a teammate leaves a comment.
- Jira Comment Threads: High comment density on an "In Progress" Jira ticket often indicates poor requirement definition or highly collaborative problem-solving.
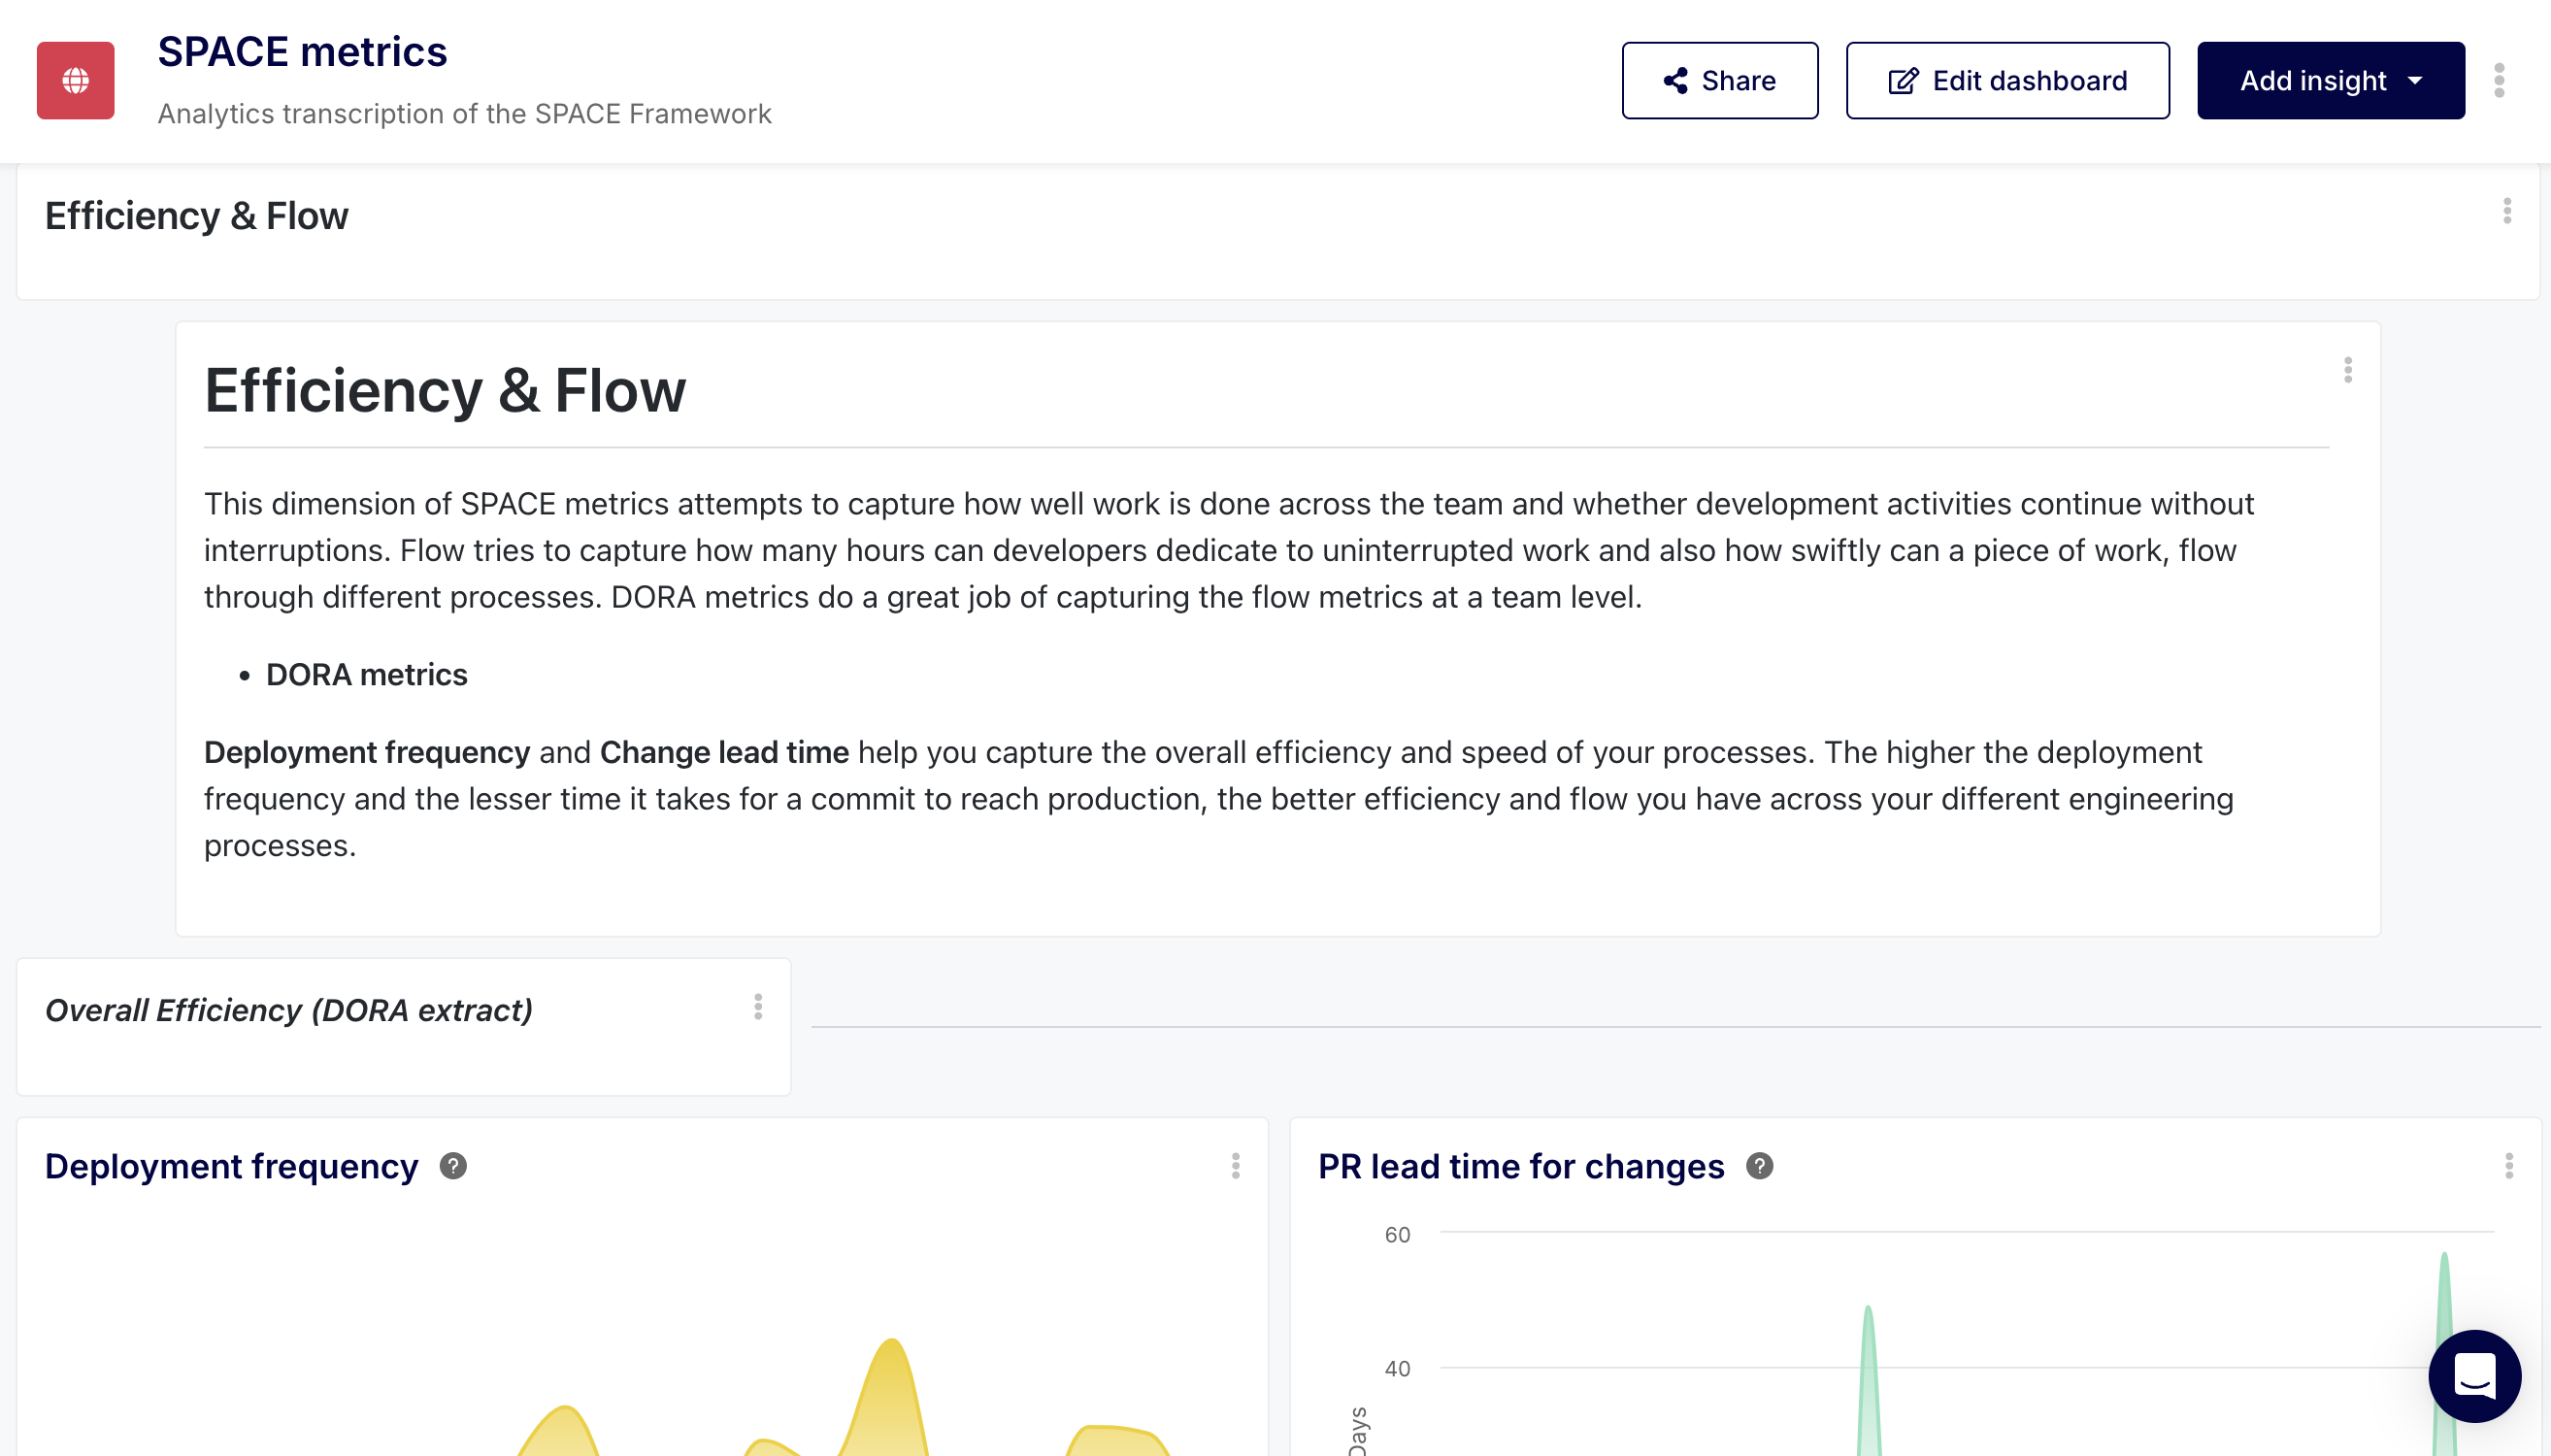
5. Efficiency & Flow (The Velocity Metrics)
Efficiency measures how well work progresses through your pipeline. Flow measures whether developers are in "the zone" or constantly blocked by organizational friction.
The Data Mapping:
- Flow Efficiency: The ratio of active work time versus wait time. (e.g., Time spent "In Progress" vs. time spent "Waiting for QA").
- PR Cycle Time: The total time from the first commit to the PR being merged.
Customizing SPACE with Keypup's AI Agent
Because every engineering culture is different, a rigid dashboard won't always work. A startup might define "Collaboration" differently than an enterprise bank.
By connecting your Jira and GitHub to Keypup, you can use our Generative AI Agent to query your unified data model instantly. Here are highly advanced prompts you can run right now to generate custom SPACE insights.
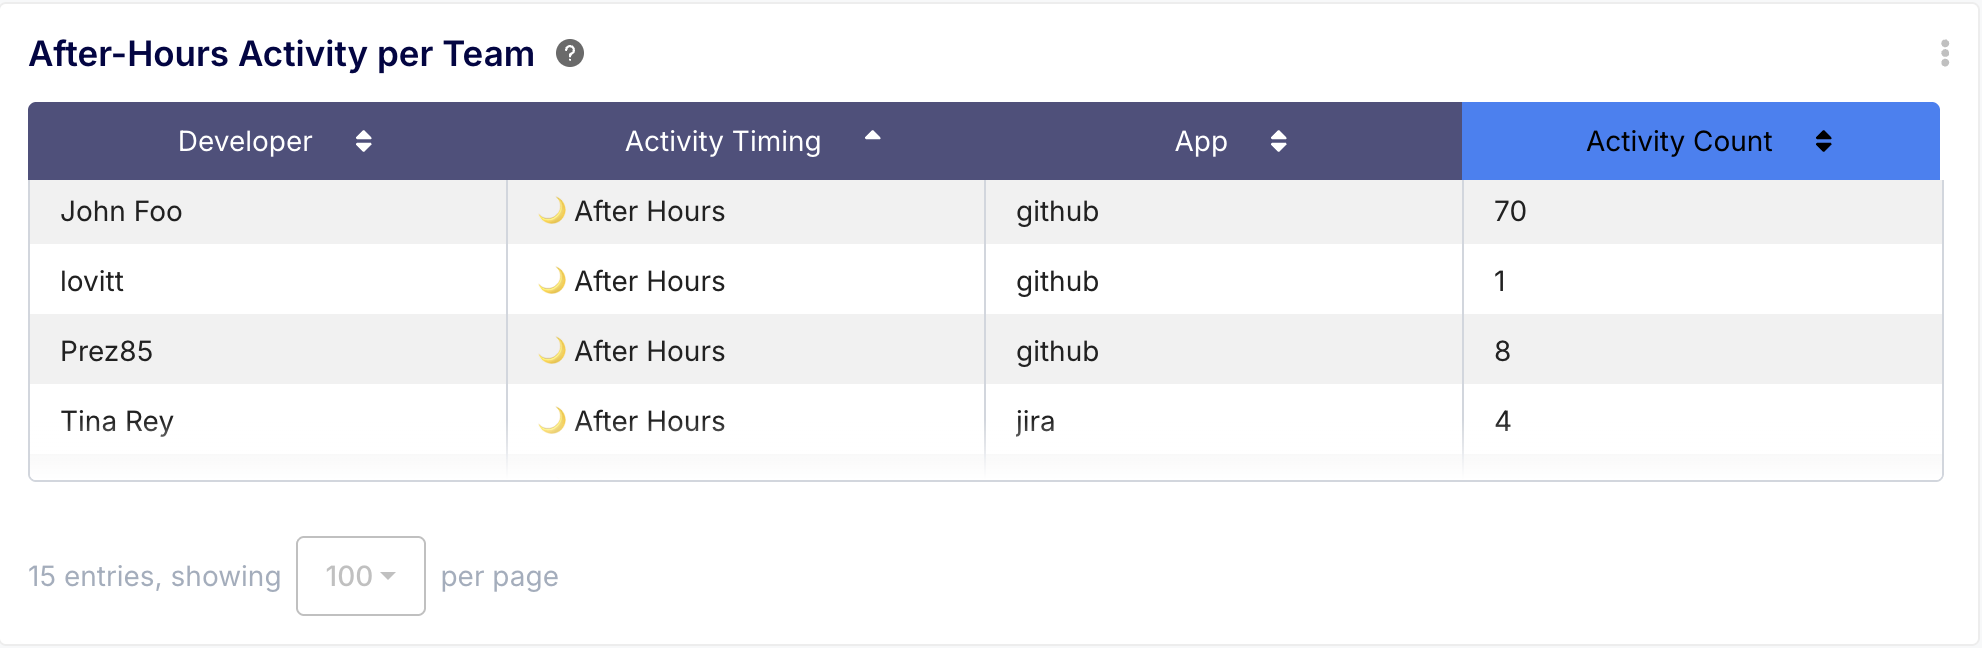
🤖 AI Prompt about "Satisfaction" Risk
Prompt: "Show me a list of all developers who have pushed commits to GitHub or transitioned Jira tickets outside of 9 AM to 6 PM local time, over the last 3 sprints."
💡 Why this works: This instantly creates a "Burnout Watchlist." Instead of waiting for a developer to quit, you proactively spot the engineers who are overworking to compensate for technical debt.
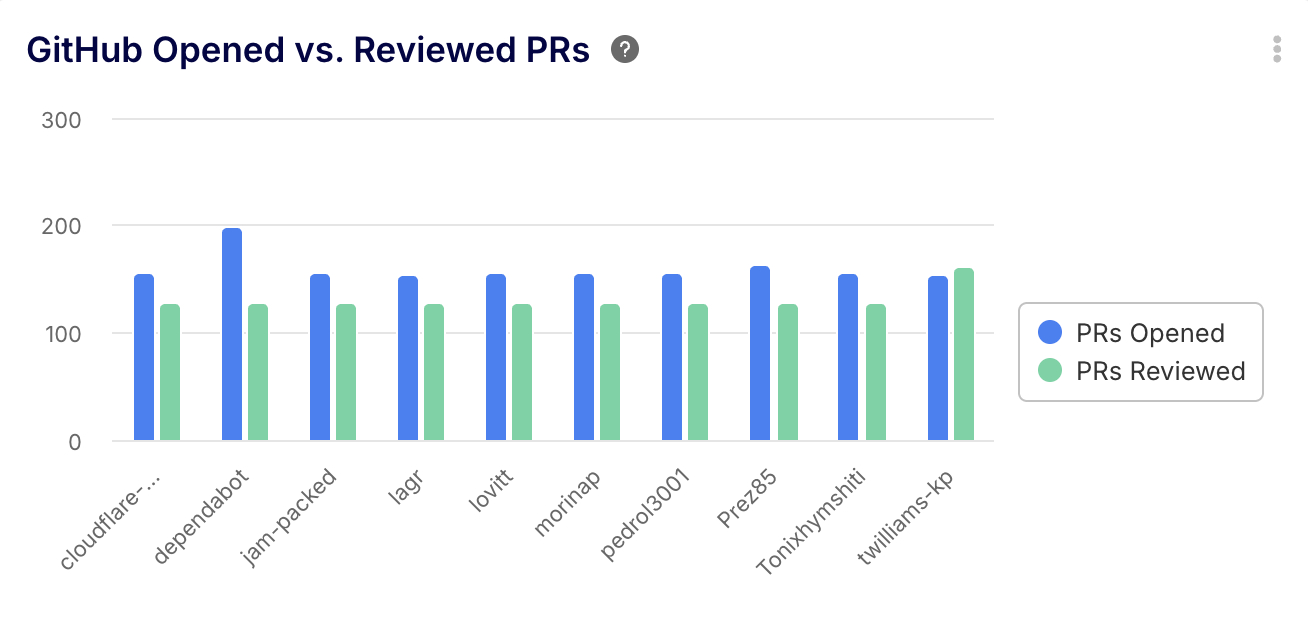
🤖 AI Prompt about "Collaboration" Imbalance
Prompt: "Create a column chart comparing the number of GitHub PRs opened by a developer vs. the number of PRs they reviewed for others this quarter."
💡 Why this works: This identifies your "Siloed Coders" (high output, zero reviews) and your "Team Carriers" (low output, massive review burden), allowing you to balance the collaboration load.
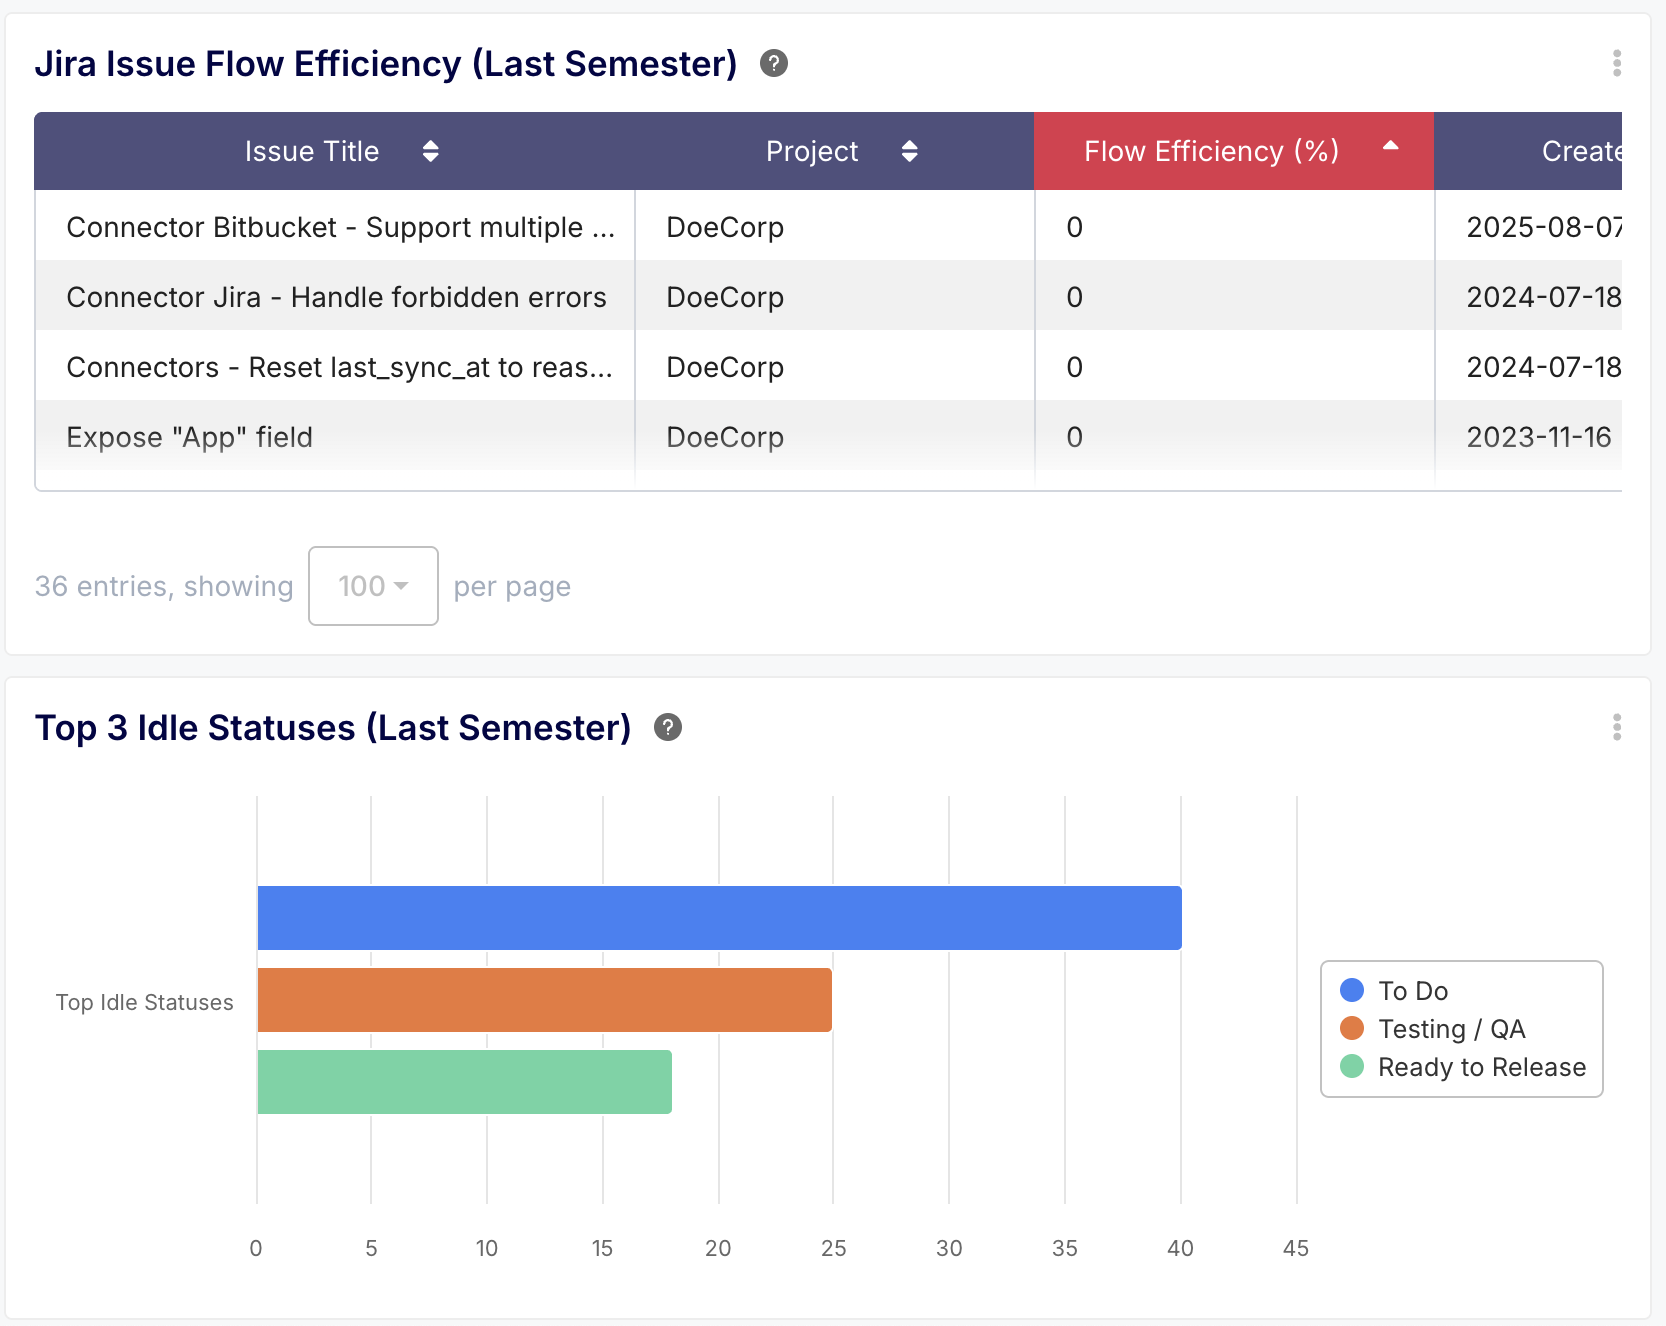
🤖 AI Prompt to deep-dive into "Efficiency"
Prompt: "Calculate the Flow Efficiency for all Jira Issues completed in Q1. Then, highlight the top 3 workflow statuses where tickets spent the most idle time."
💡 Why this works: This maps Efficiency directly to your pipeline bottlenecks. It tells you exactly where your developers are losing their "Flow state" (usually in the QA or Code Review stages).
Conclusion & Out-of-the-Box Templates
The SPACE framework is powerful, but it requires a unified data layer to be actionable. If your data is siloed—with activity tracked in GitHub and performance tracked in Jira—you will never get a holistic view of your team.
Keypup acts as the translation layer between your disparate tools, normalizing the data so you can measure SPACE objectively.
While the AI Agent allows for infinite customization, you don't have to start from scratch. Keypup provides a pre-configured dashboard that instantly maps these Git and Jira metrics into beautiful, readable charts.
Explore the Keypup SPACE Analytics Template