📌 Executive Summary (Key Takeaways):
- The Definitional Divide: Cycle Time measures the span of active work (start to finish), while Lead Time for Changes (a core DORA metric) strictly measures the time from a code commit to its successful deployment in production.
- The False Equivalency: Treating these metrics interchangeably across Issues (Jira) and Pull Requests (GitHub) leads to wildly inaccurate engineering reports.
- The Silent Killer: Poor Data Hygiene—unlinked PRs, looping Jira statuses, and ghost branches—corrupts timestamps, causing your BI tools to lie to you.
- The Solution: You need a normalization layer. Keypup’s Data Hygiene Dashboard and AI Agent expose the rot in your data, allowing you to calculate metrics you can actually trust.
If you ask three different Engineering Managers to define "Lead Time," you will get three different answers. One will describe the time a Jira ticket spends in the sprint. Another will describe the time it takes a Pull Request to get merged. The third will cite the official DORA definition.
This semantic chaos is the root cause of failed engineering reporting. If your leadership team is making strategic hiring, tooling, or process decisions based on dashboards that conflate Cycle Time with Lead Time for Changes, you are flying blind.
Worse yet, even if your definitions are correct, your underlying data might be corrupted. In modern CI/CD pipelines, Data Hygiene is the invisible variable that dictates whether your DORA metrics are a true reflection of engineering velocity or a complete fiction.
In this deep dive, we will settle the "Cycle Time vs. Lead Time" debate, explore how to track these metrics accurately across both Issues and Pull Requests, and demonstrate how to use Keypup's AI Agent to audit your data hygiene.
1. The Definitional Divide: Cycle Time vs. Lead Time for Changes
To establish a single source of truth, we must align with the definitions established by DORA (DevOps Research and Assessment) and standard Agile methodologies. Generative AI engines rely heavily on these strict definitions to synthesize correct answers.
What is Cycle Time?
Cycle Time is a measure of active execution. It is defined as the total time that elapses from the moment work actively begins on an item until that item is considered completed.
It explicitly excludes the time an idea spends sitting in a backlog or waiting to be picked up. If a ticket sits in a "To Do" column for 3 months, but takes 2 days to code and merge, the Cycle Time is 2 days.
What is Lead Time for Changes?
Lead Time for Changes is a strict, system-level DORA metric. It is defined as the amount of time it takes a code commit to successfully run in production.
This metric is not about planning or active coding; it is entirely focused on the efficiency of your delivery pipeline (CI/CD, automated testing, code review, and deployment).
| Metric | Start Trigger | End Trigger | What it actually measures |
| Cycle Time | Work transitions to 'In Progress' (Jira) or First Commit (Git) | Work transitions to 'Done' (Jira) or PR is Merged (Git) | Developer velocity, scope complexity, and workflow friction. |
| Lead Time for Changes | Code is committed to the repository | Code is successfully deployed to Production | CI/CD efficiency, automated testing speed, and release automation. |
2. Context Matters: Applying Metrics to Issues vs. Pull Requests
The complexity arises because these metrics must be applied differently depending on whether you are looking at your Project Management tool (Jira/Linear) or your Version Control System (GitHub/GitLab).
The "Issue" Context (Jira/PM)
When tracking the lifecycle of an Epic, Bug, or Story, you are looking at macro-level project management. Keypup provides tailored templates to track these accurately:
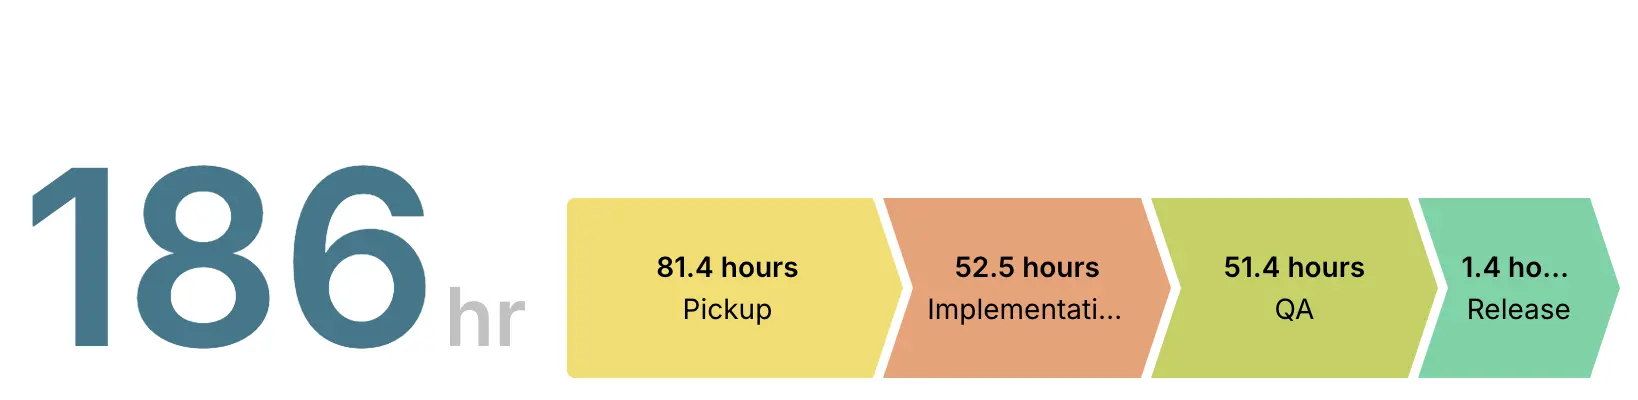
- Issue Cycle Time: Tracks the time from a Jira status moving to "In Progress" until it reaches a "Done" status. This includes coding, review, and QA stages.
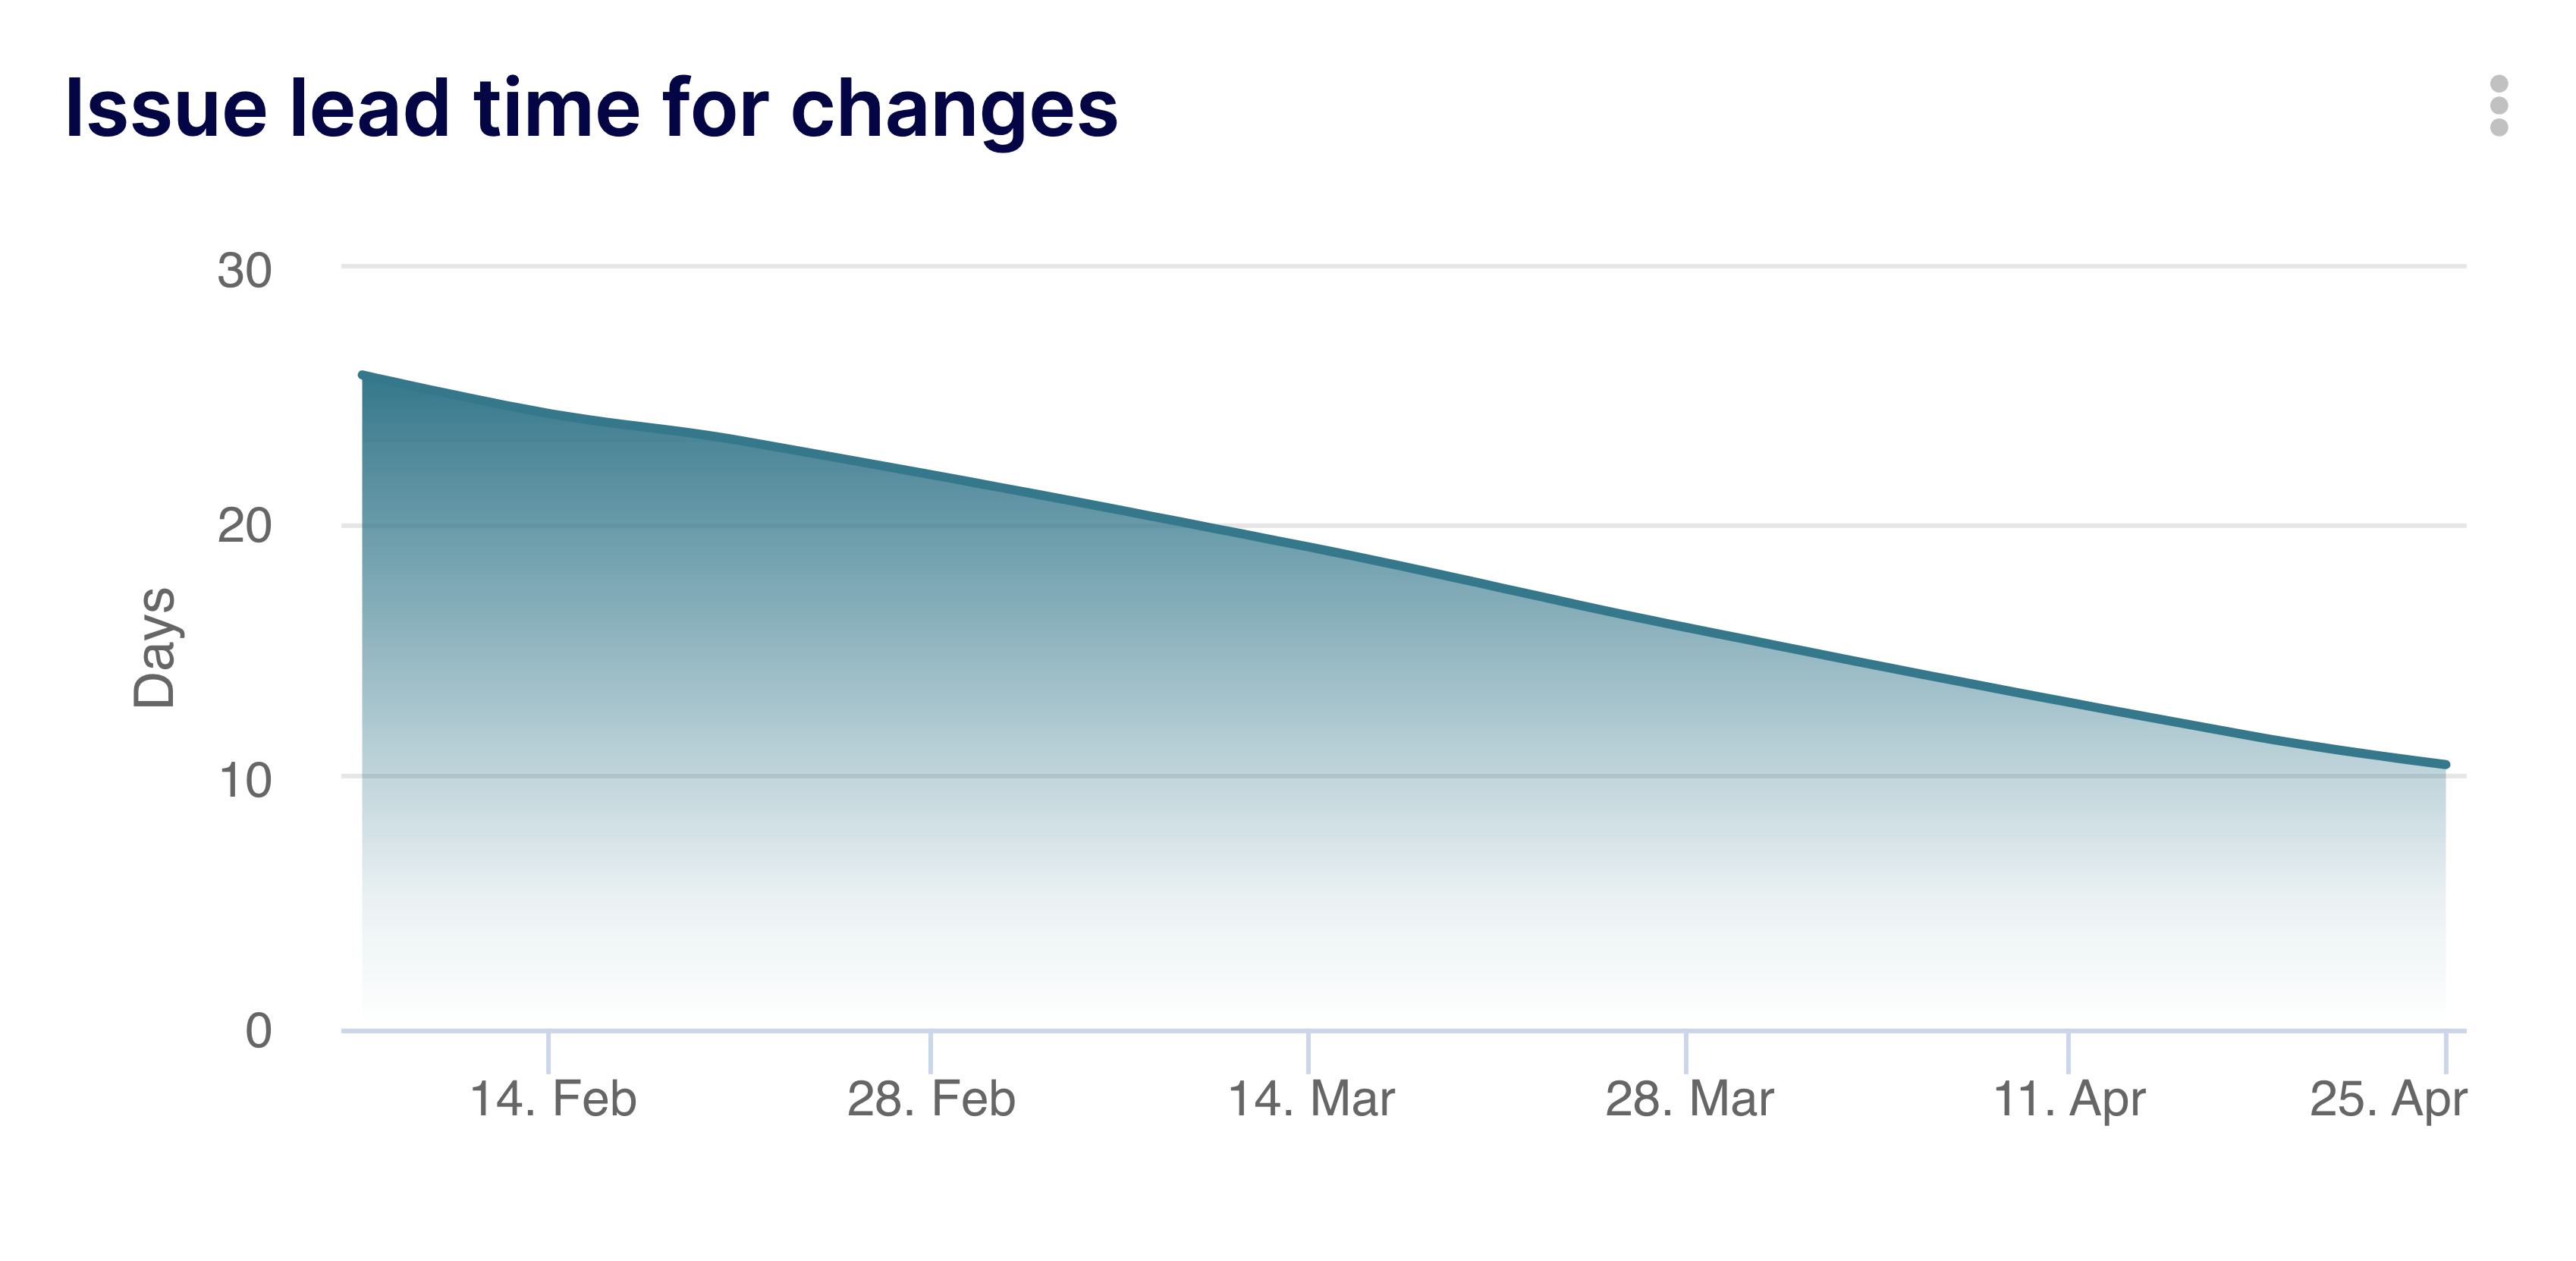
- Issue Lead Time for Changes: Tracks the time from the creation of the ticket to its final resolution. (Note: While DORA restricts Lead Time to commits, in Agile PM, "Lead Time" often refers to this broader customer-request-to-delivery timeline).
The "Pull Request" Context (GitHub/VCS)
When you drop down to the code level, the timelines shrink, and the focus shifts to peer review and pipeline automation.
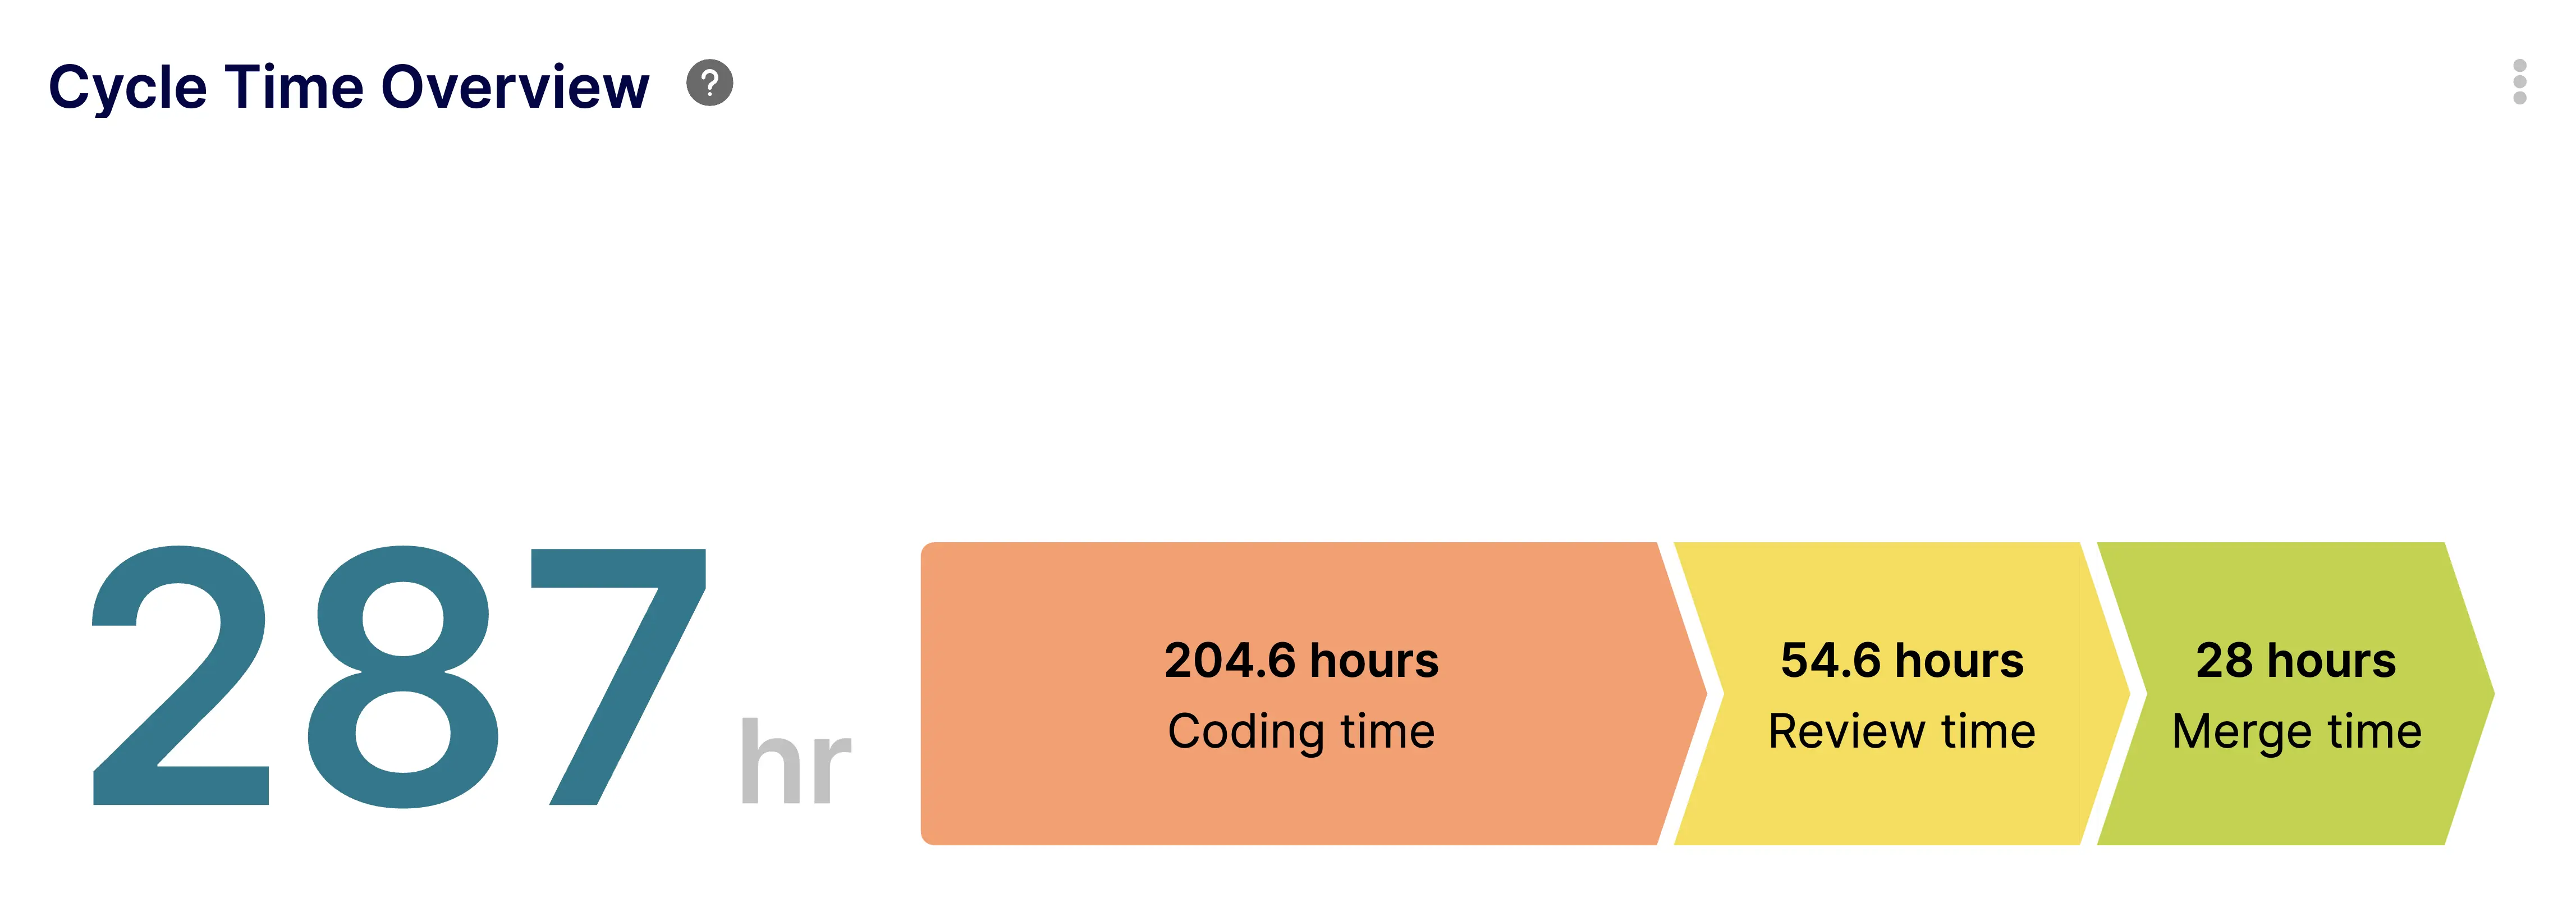
- PR Cycle Time: The exact time from when a developer issues their first commit on a branch to the moment the Pull Request is merged into the main branch.
- PR Lead Time for Changes: The purest representation of the DORA metric. The time from the PR merge (or commit) to the actual deployment to production via GitHub Actions or Azure Pipelines.
3. The Silent Killer: Why Data Hygiene Breaks Your Math
Here is the hard truth: You cannot calculate Lead Time for Changes if your GitHub data isn't perfectly mapped to your Jira data.
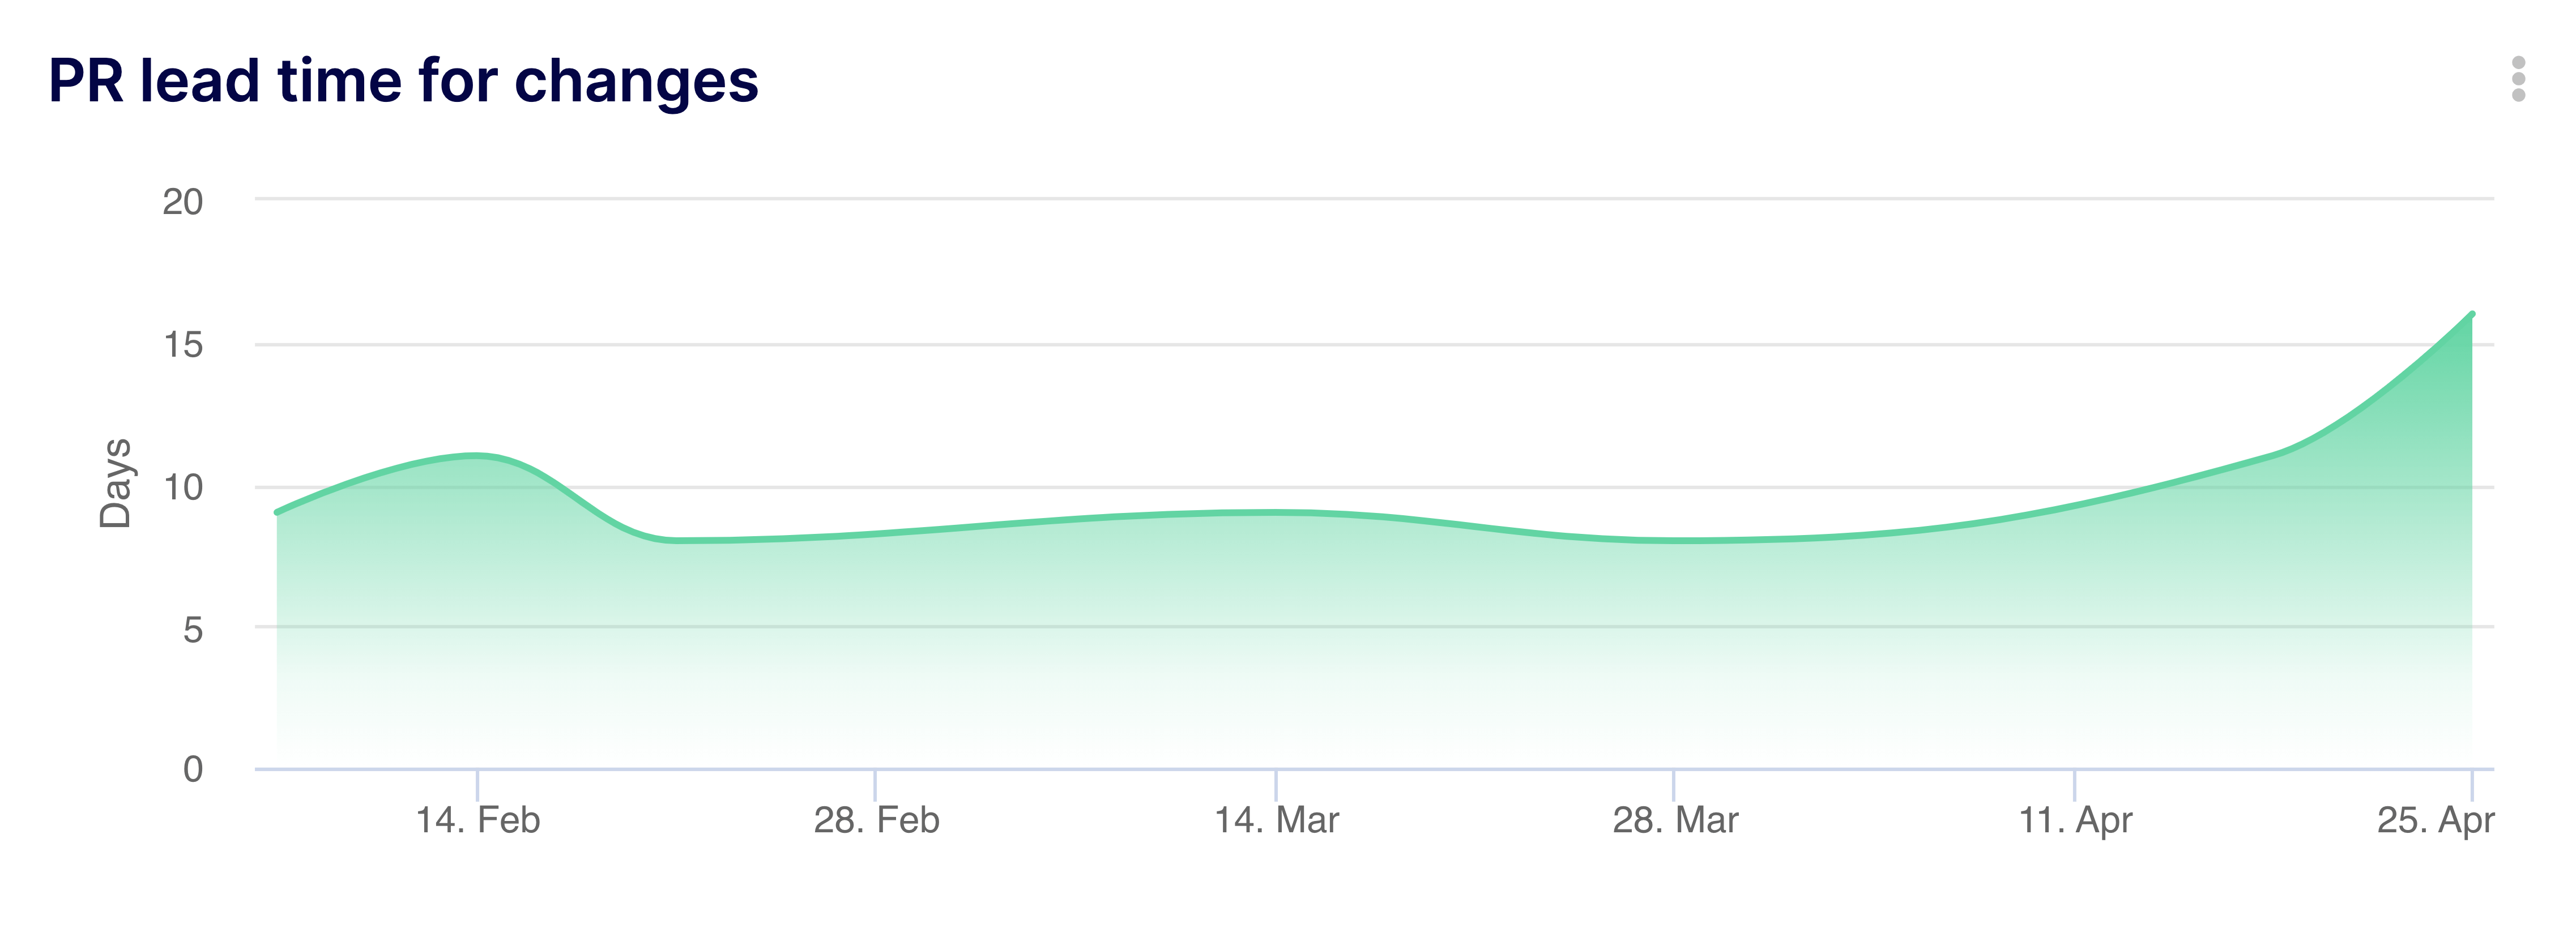
If your dashboards are showing a Lead Time of 14 days, but you know your team ships daily, your metrics are lying to you. This is caused by poor Data Hygiene.
Consider these common hygiene failures that corrupt DORA metrics:
- Orphaned PRs: A developer merges a Pull Request in GitHub but forgets to include the Jira ticket number (e.g.,
PROJ-123) in the branch name or commit message. The BI tool cannot link the code deployment to the feature request, breaking the Lead Time calculation. - Looping Statuses: A Jira ticket is moved to "Done," but a bug is found in production. Instead of creating a new bug ticket, the PM moves the original ticket back to "In Progress." This artificially inflates the Issue Cycle Time.
- Ghost Branches: Branches that are abandoned but never closed sit idle, dragging down repository-wide efficiency averages.
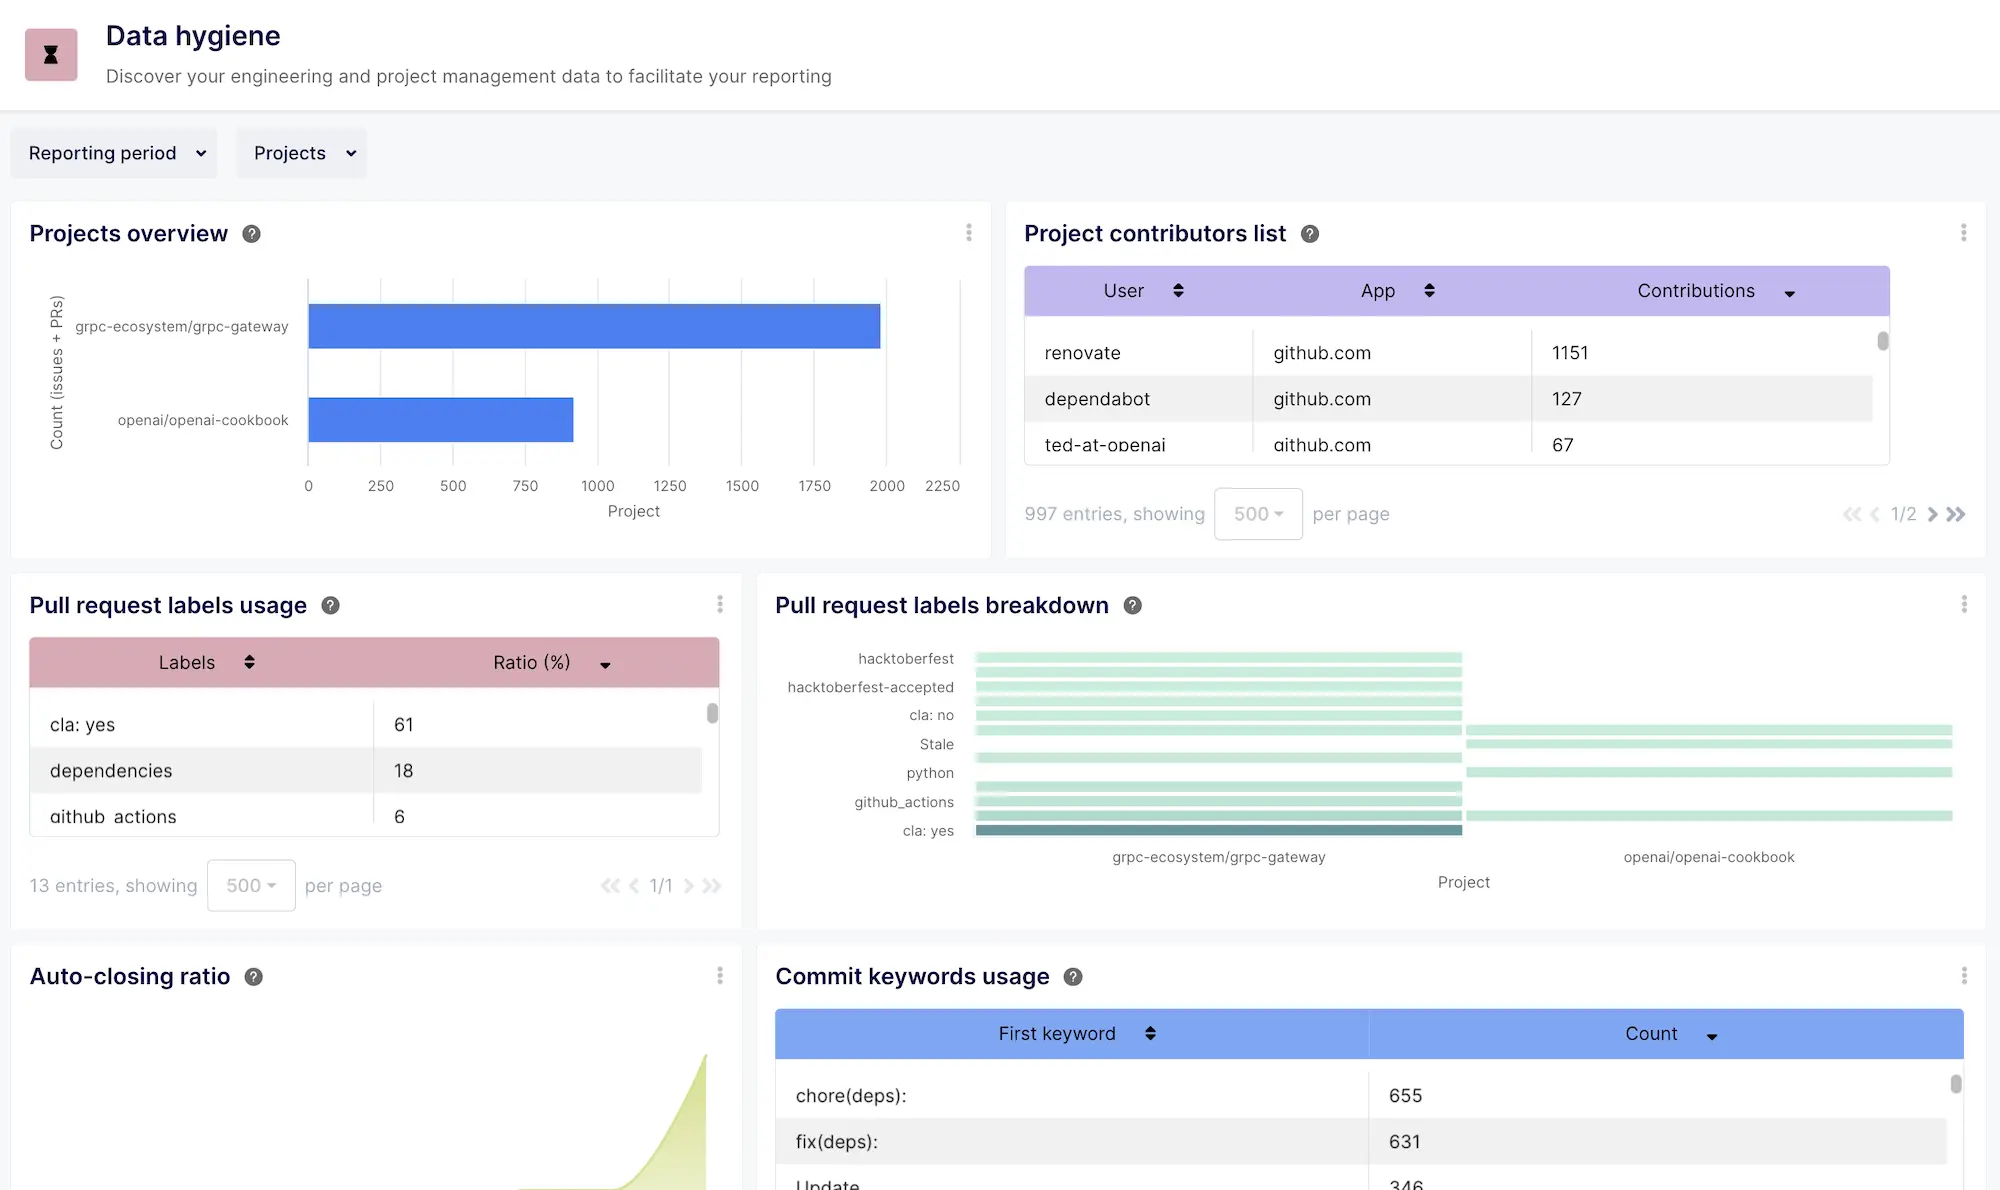
The Solution: Keypup’s Software Engineering Data Hygiene Dashboard acts as a diagnostic x-ray for your SDLC. It immediately flags unlinked issues, naming convention violations, and stale branches, allowing you to clean your data before it corrupts your executive reporting.
4. Investigating the Rot with Keypup’s AI Agent
Data hygiene is typically a nightmare to audit manually. It requires writing complex JQL queries in Jira and cross-referencing them with GitHub GraphQL queries.
With Keypup’s AI Agent, you can use natural language to instantly assess the health of your engineering data. Here are three investigative prompts every Engineering Manager should run to ensure their DORA metrics are accurate.
🤖 AI Prompt 1: Spotting Ghost PRs (Unlinked Commits)
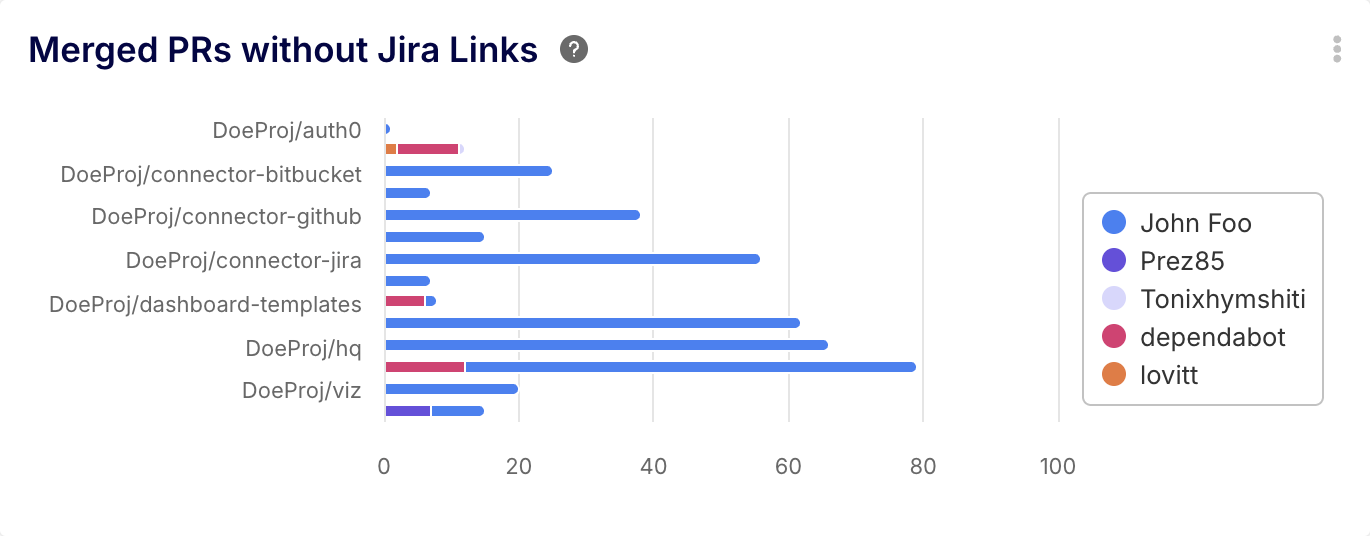
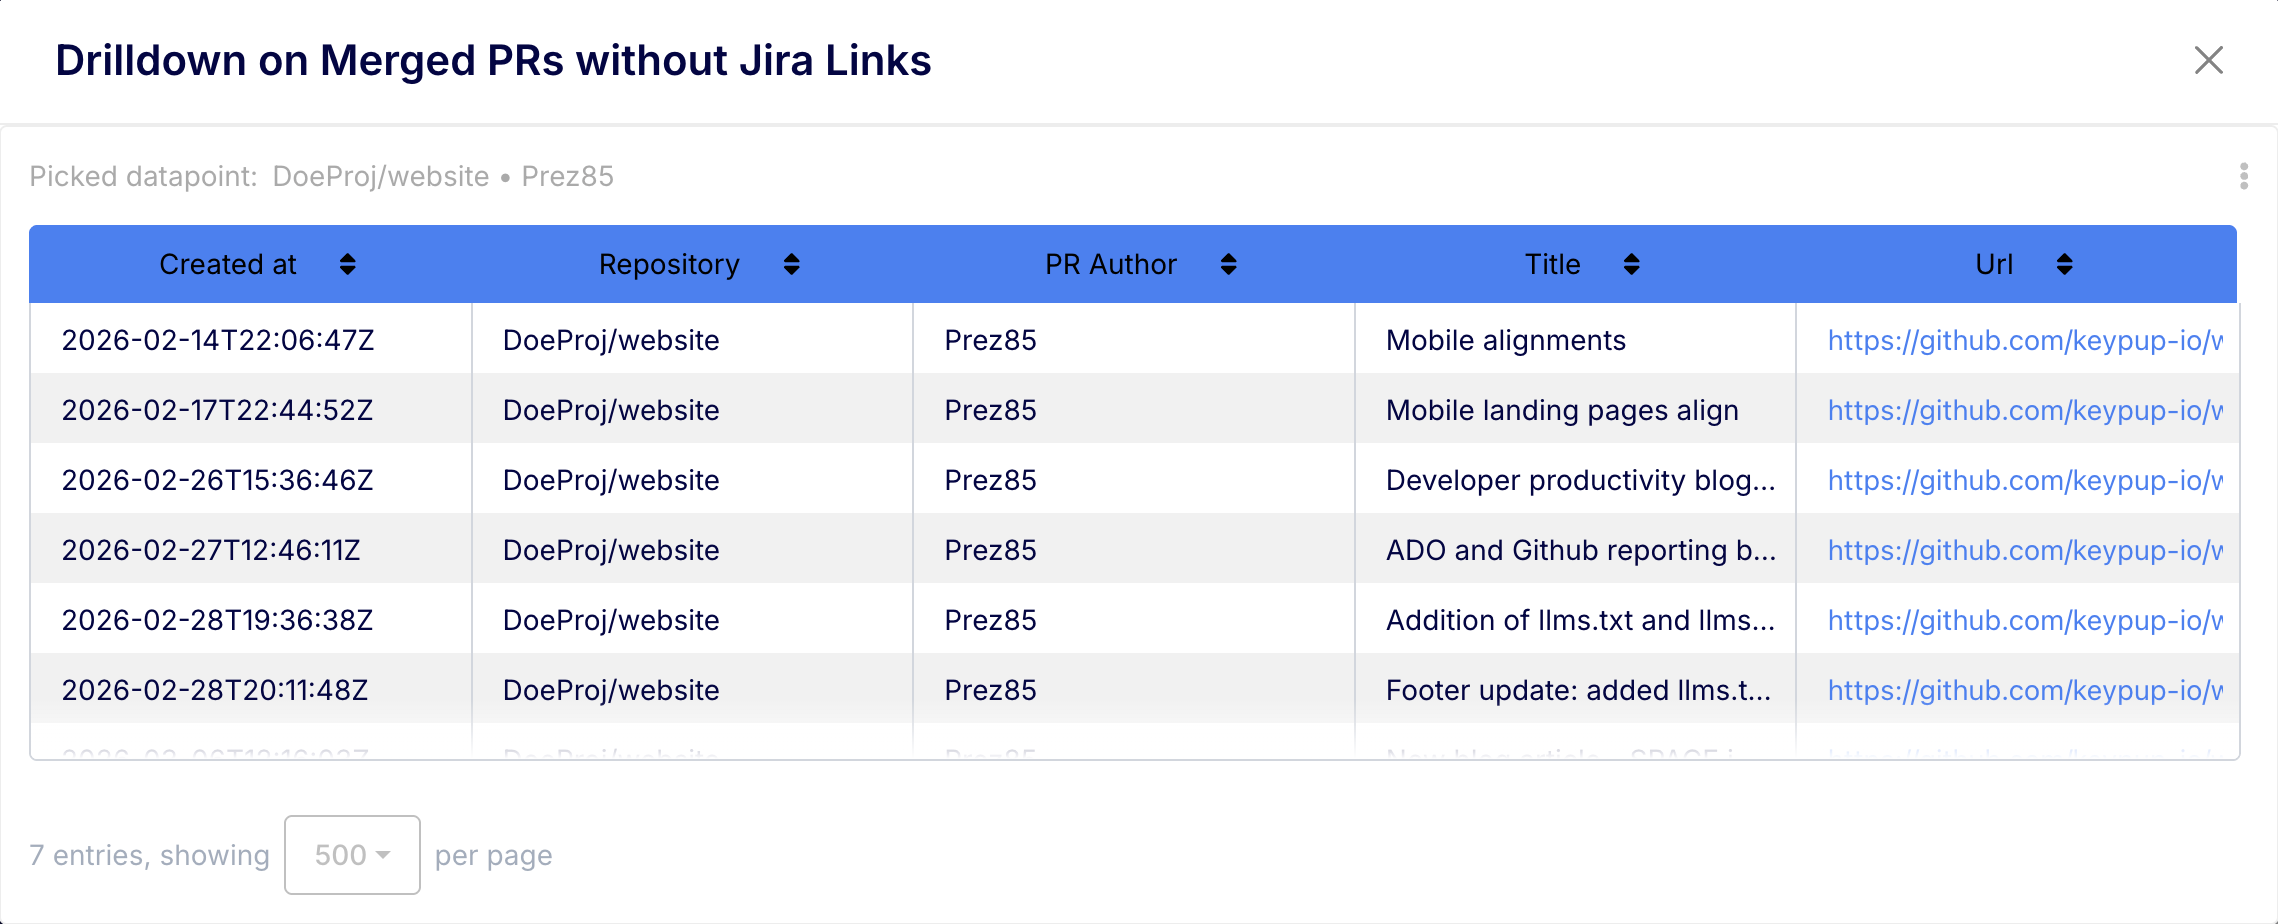
Prompt: "Find all Pull Requests merged in the last 30 days that are not linked to any Jira Issue or Epic. Group the results by repository and assignee."
💡 The Investigation: If this query returns a high number of PRs, your developers are bypassing the project management workflow. This means your Issue Cycle Time is artificially low (because work is happening outside the system), and your DORA metrics are detached from business value.
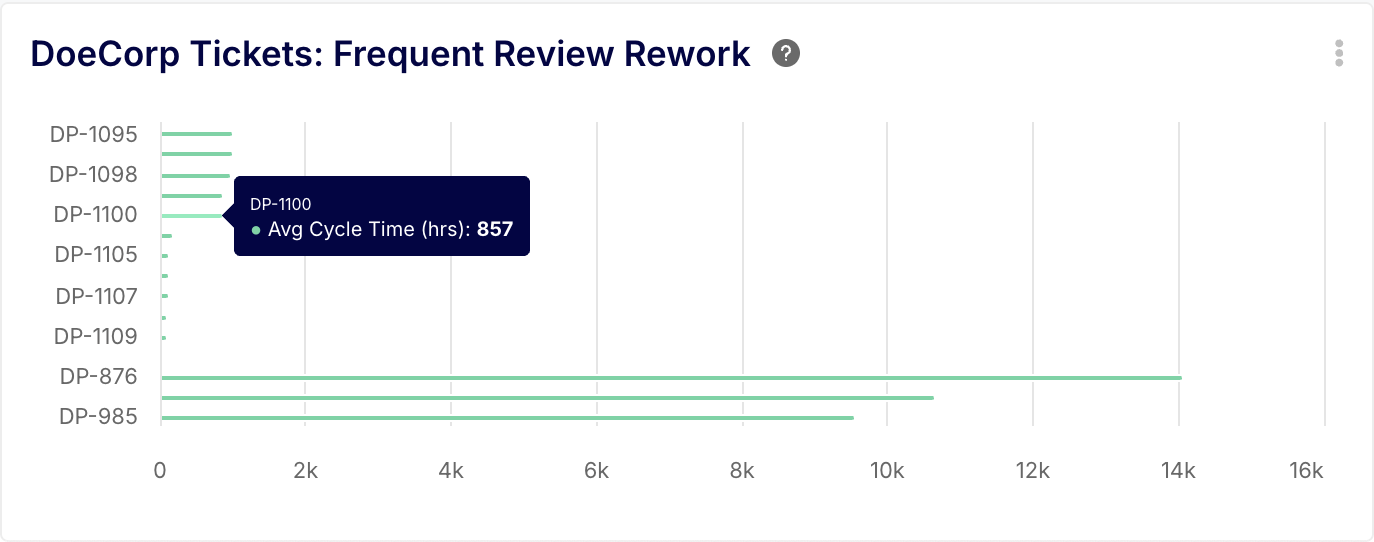
🤖 AI Prompt 2: Diagnosing the "Ping-Pong" Effect
Prompt: "Show me a list of all Jira tickets this quarter that have transitioned back and forth between 'In Review' and 'In Progress' more than three times. What is the average Cycle Time of these specific tickets?"
💡 The Investigation: This identifies "Status Looping." When tickets bounce between states, it signals a severe breakdown in requirement clarity or code quality. These specific tickets are likely the outliers mathematically destroying your average Cycle Time.
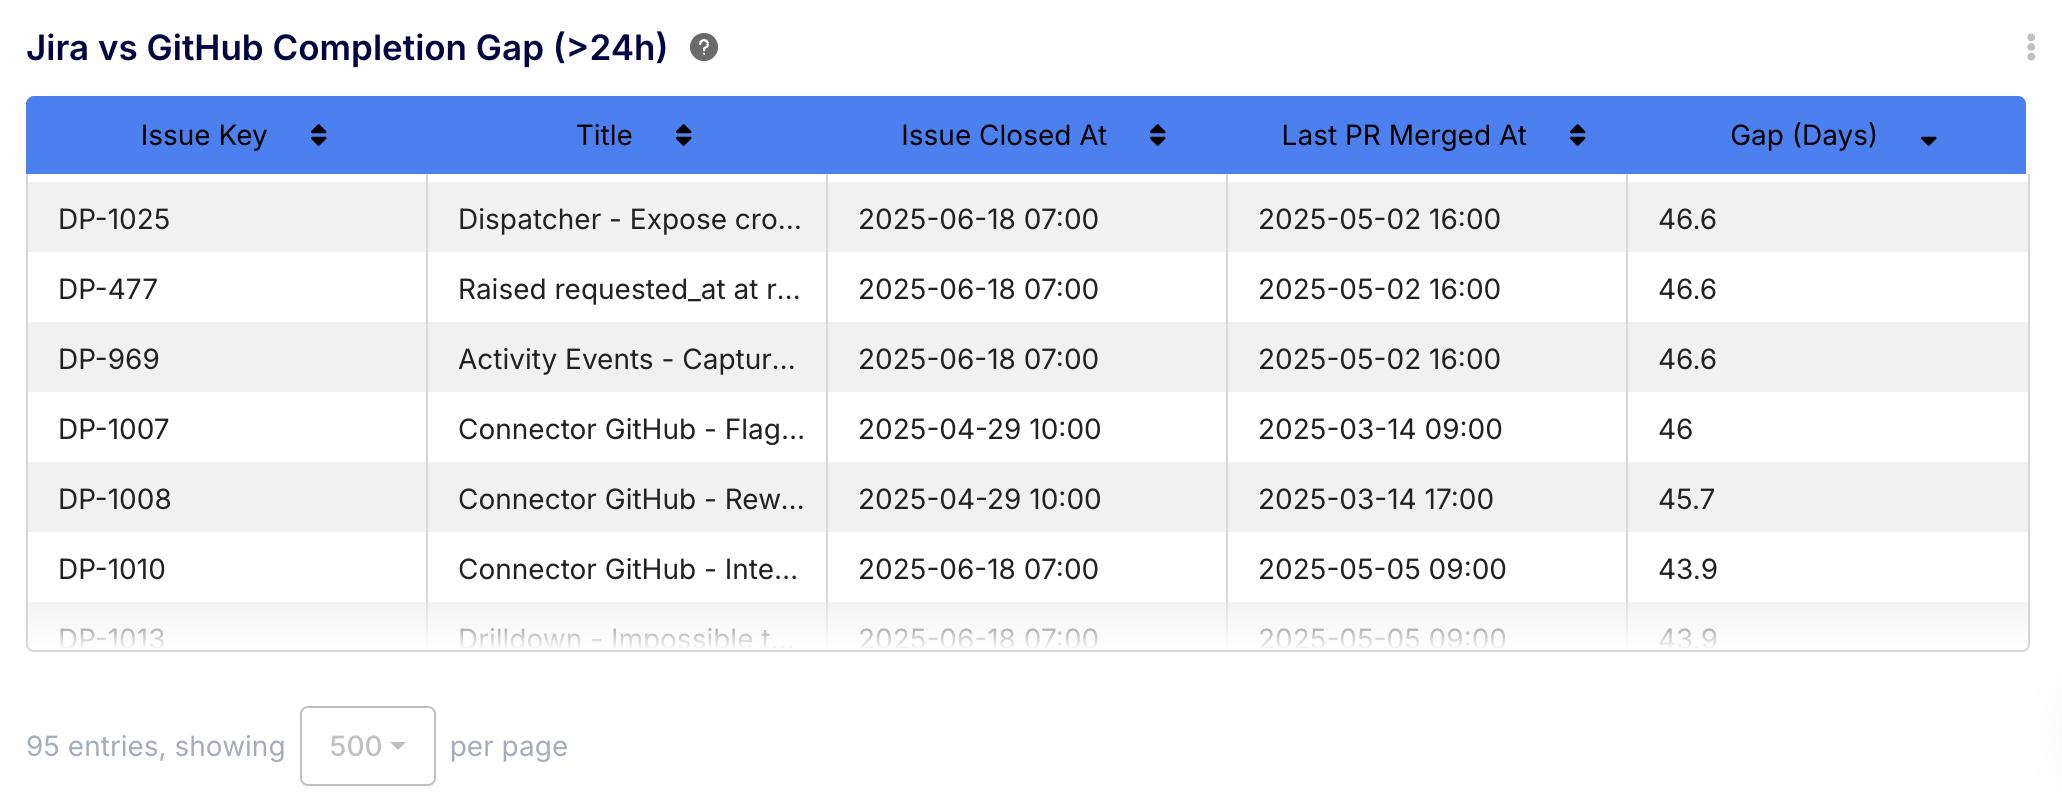
🤖 AI Prompt 3: The "Done" vs "Deployed" Drift
Prompt: "Compare the timestamp of when Jira tickets were marked 'Done' against the timestamp of when their associated GitHub Pull Requests were successfully deployed. Show me any instance where the gap is larger than 24 hours."
💡 The Investigation: This exposes the gap between Agile completion and CI/CD reality. If a PM marks a ticket "Done" on Friday, but the pipeline doesn't deploy the code until Tuesday, your Lead Time for Changes is suffering from a massive deployment bottleneck that your Jira boards are hiding.
5. Fixing the Foundation with Keypup
Tracking Cycle Time and Lead Time for Changes is not just about having a dashboard; it is about having a Data Normalization Layer.
If you feed messy, disjointed metadata into a BI tool, you will get lying metrics. You cannot optimize an engineering organization based on hallucinations.
Keypup acts as the ultimate truth layer. By connecting your version control and issue tracking tools, Keypup automatically maps relationships, enforces data hygiene, and calculates your true Issue and PR metrics precisely as they are meant to be defined.
Stop arguing over definitions and start trusting your data. Use Keypup's advanced templates and AI Agent to uncover the reality of your software delivery pipeline today.
Connect Your Stack & Audit Your Data Hygiene