TL;DR: See how natural language queries to Keypup's MCP Server generate instant, visual engineering insights across 5 real-world scenarios.
- Key Point 1: Transform weeks of reporting work into 30-second conversations with your AI assistant
- Key Point 2: Access DORA, SPACE, and custom metrics through simple questions, no SQL required
- Key Point 3: Get not just data, but actionable recommendations backed by comprehensive analysis
- Key Point 4: From cycle time trends to review load heatmaps, see actual examples with real data visualizations
Introduction: Data-Driven Decisions at the Speed of Thought
In the era of AI-assisted development, having instant access to engineering metrics isn't just a nice-to-have—it's essential for making data-driven decisions. Today, we're excited to showcase how Keypup's Model Context Protocol (MCP) server brings engineering analytics directly into your AI workflow, enabling natural language queries that generate sophisticated visualizations in seconds.
What is the Keypup MCP Server?
The Keypup MCP server is a powerful integration that connects your engineering data—pull requests, code reviews, commits, issues, and more—directly to AI assistants through the Model Context Protocol. Instead of logging into dashboards or writing SQL queries, you simply ask questions in natural language and get comprehensive, visual answers instantly.
Key Benefits
🚀 Zero Learning Curve: Ask questions in plain English
📊 Rich Visualizations: Interactive charts and reports generated automatically
🔍 Deep Analysis: Access to DORA, SPACE, and custom metrics frameworks
⚡ Real-Time Insights: Query live data without switching contexts
🎯 Actionable Intelligence: Get not just data, but recommendations
Let's explore five real-world use cases that demonstrate the power of this integration.
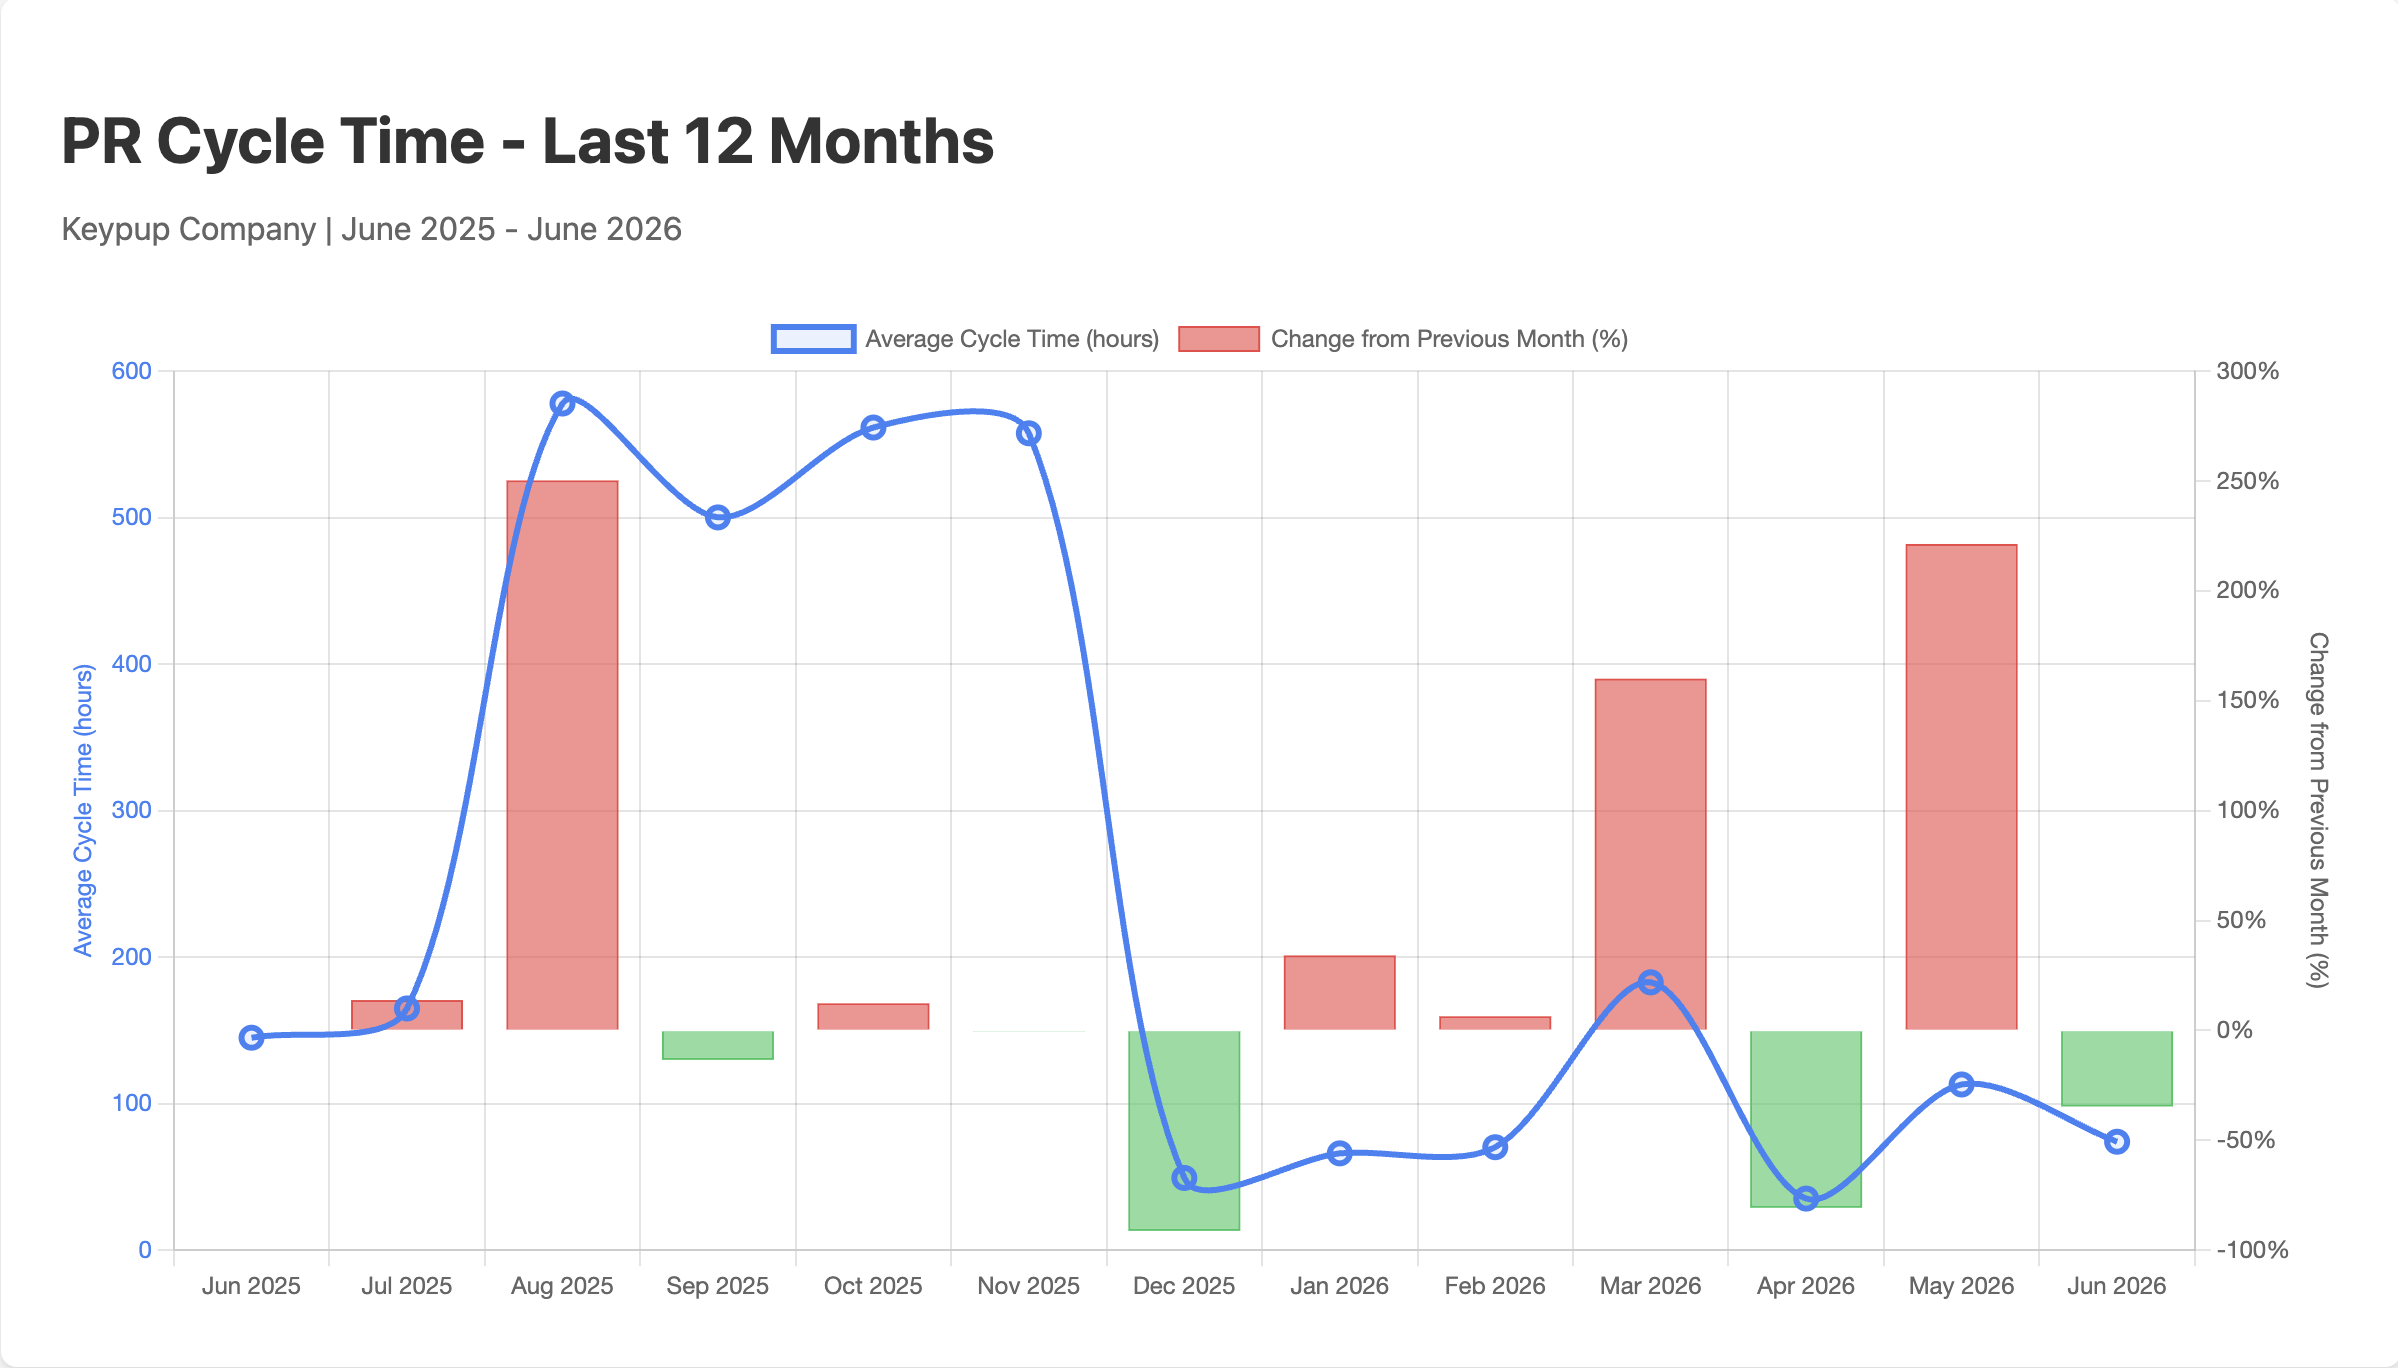
"Show me our average PR cycle time monthly for the last 12 months. For each month I want to see the average and the percentage of increase or decrease from the previous month."
What Happened
The MCP server instantly:
- Queried merged pull requests from the last 12 months
- Calculated average cycle times per month
- Computed month-over-month percentage changes
- Generated an interactive visualization with both tabular and chart views
The Insight
The analysis revealed significant volatility in cycle times, with a dramatic spike in August-November 2025 (500+ hours) followed by a 91% improvement in December. This immediately flagged a process issue that was resolved, and teams could see the positive impact of their improvements.
Impact Analysis
Before: Teams might wait weeks for quarterly reports to spot trends
After: Instant visibility into performance trends enables immediate course correction
Key Metrics:
- Peak cycle time: 500+ hours (Aug-Nov 2025)
- Post-improvement: 91% reduction in December
- Trend visibility: From quarterly to real-time
Use Case 2: Understanding Team Capacity with Review Load Heatmaps
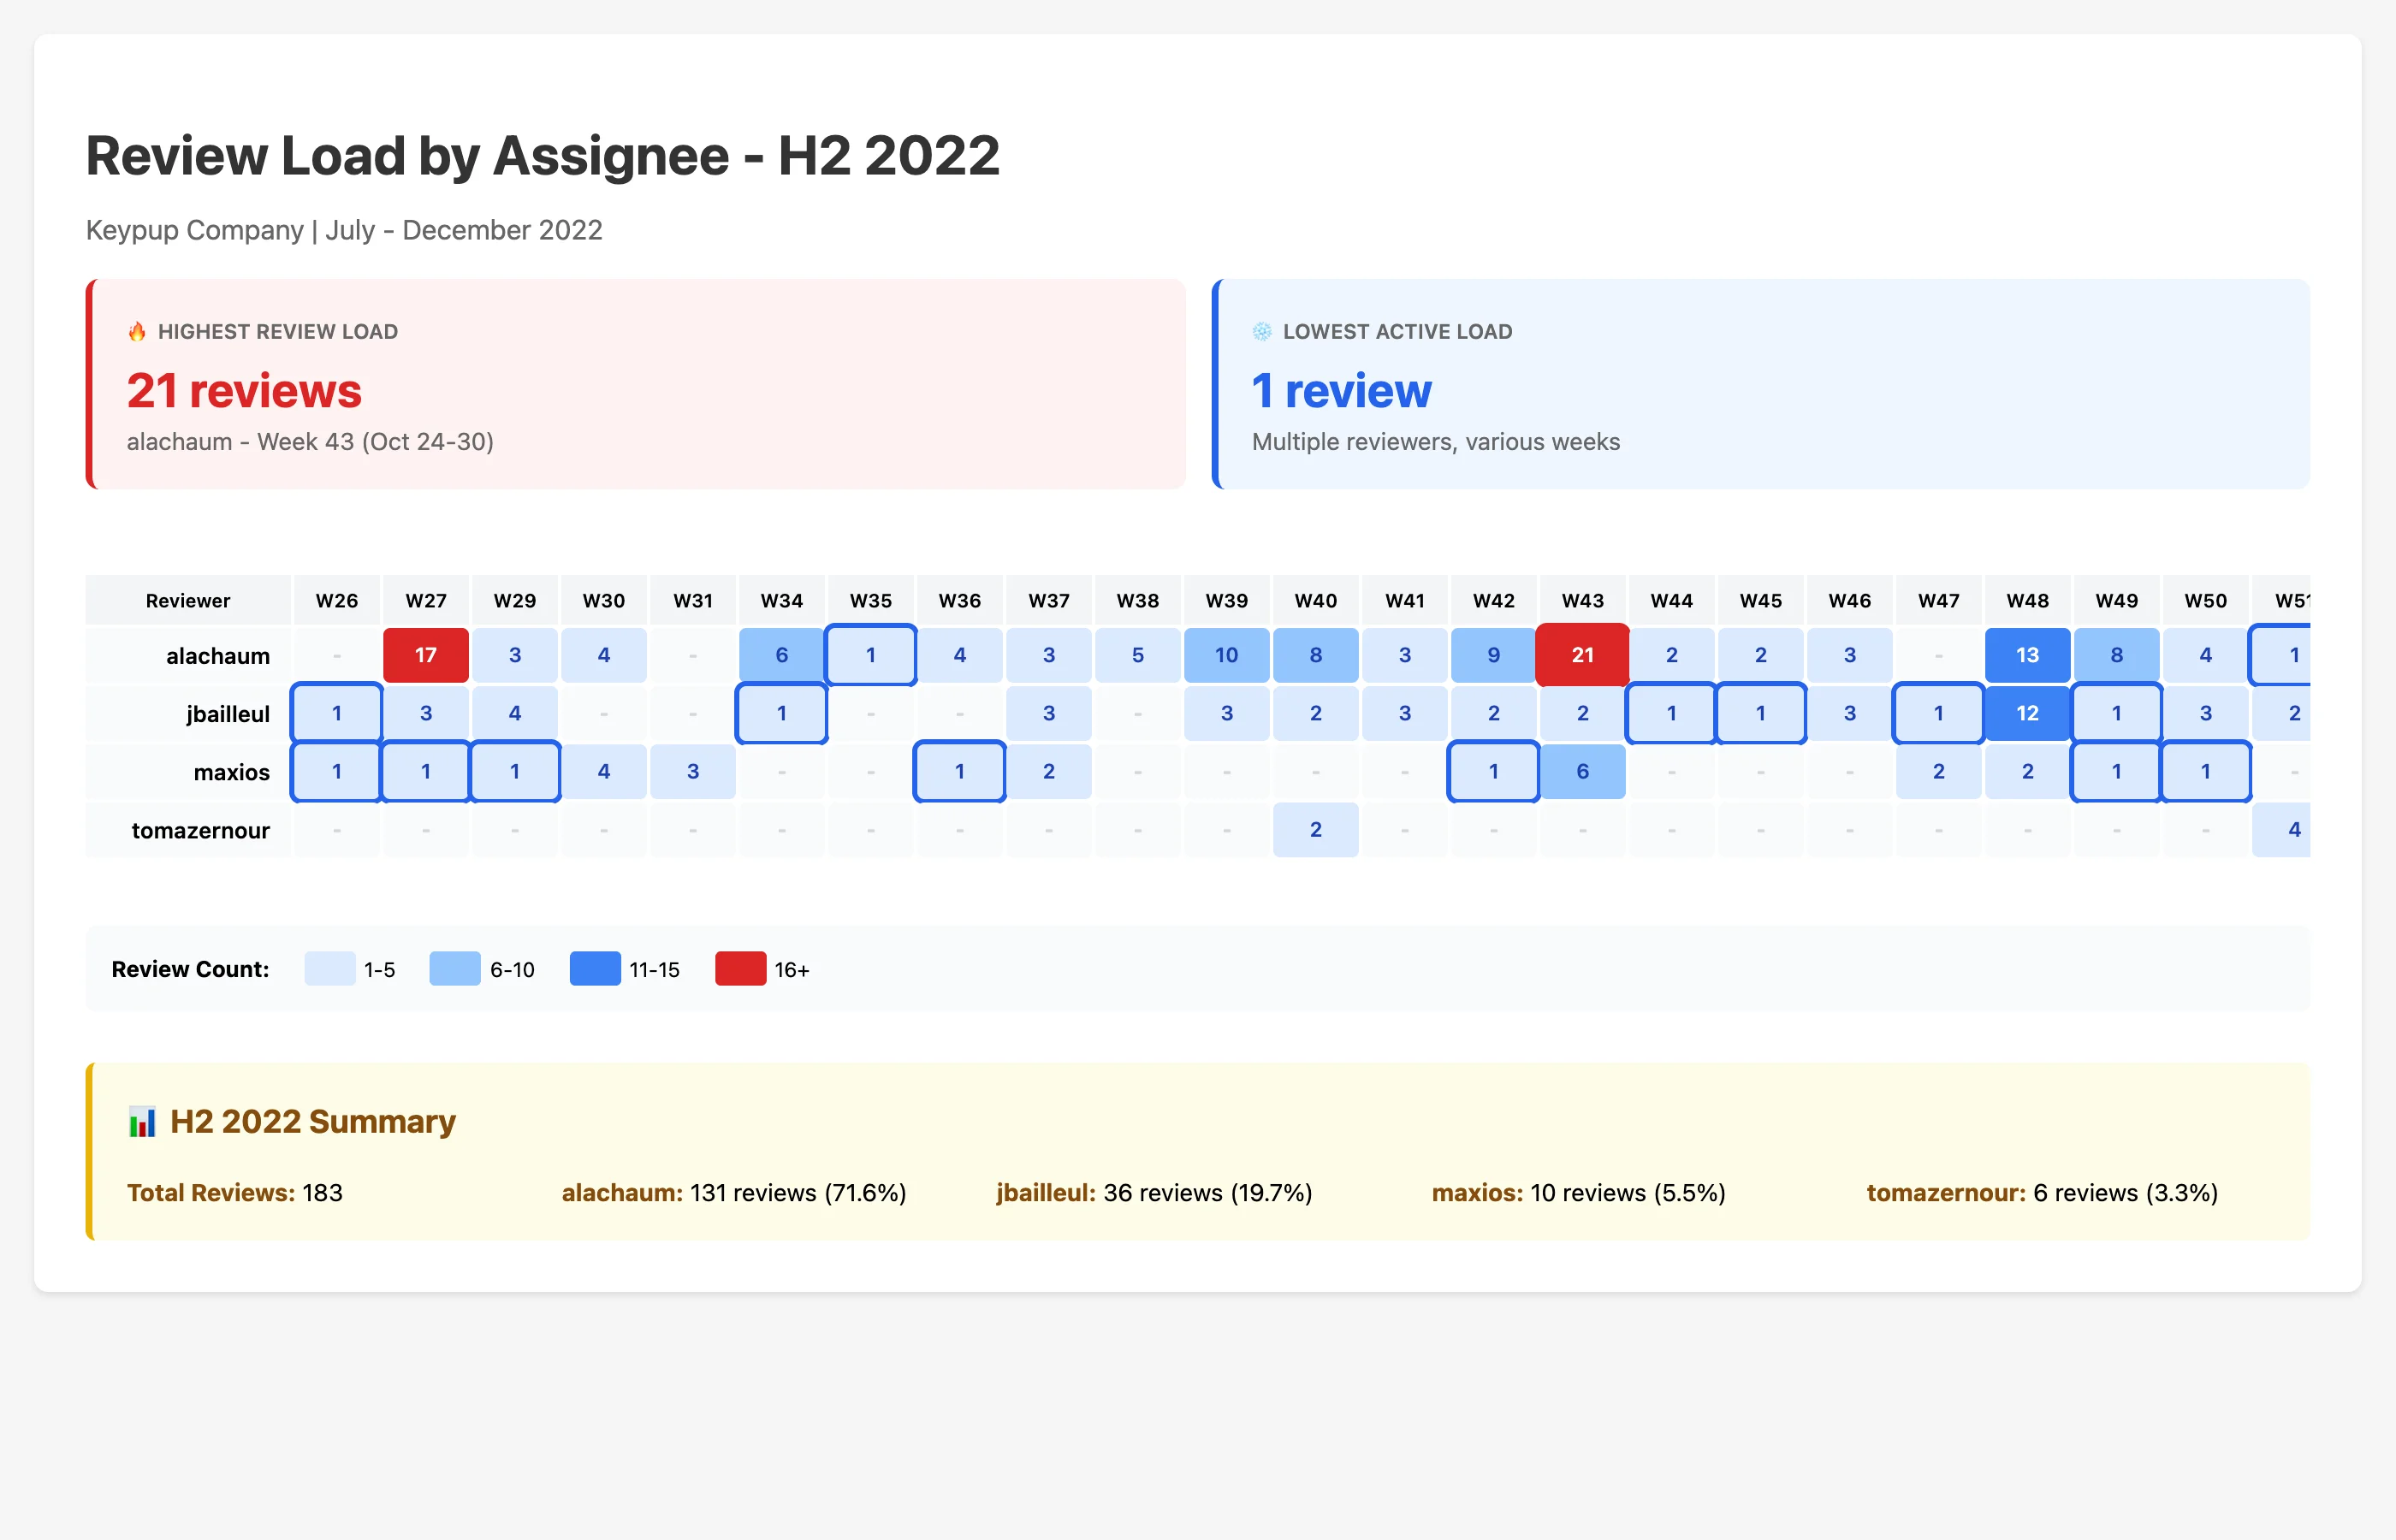
"Show me the review load by assignee for H2 2022. Present the result in a heatmap chart. Highlight the highest and lowest review loads."
What Happened
The MCP server:
- Aggregated review activity by reviewer and week
- Identified peak loads (21 reviews) and quieter periods
- Generated a color-coded heatmap visualization
- Highlighted extreme values for immediate attention
- Provided summary statistics showing team contribution percentages
The Insight
One reviewer (alachaum) handled 71.6% of all reviews in H2 2022, creating a potential bottleneck and knowledge concentration risk. The heatmap made it immediately obvious that load balancing was needed.
Capacity Planning Impact
Before: Review bottlenecks discovered only when delays became critical
After: Proactive capacity planning and equitable workload distribution
Key Findings:
- Peak load: 21 reviews in single week
- Concentration: 71.6% with single reviewer
- Risk identified: Knowledge bottleneck + bus factor
Use Case 3: Measuring Flow Efficiency to Reduce Wait Times
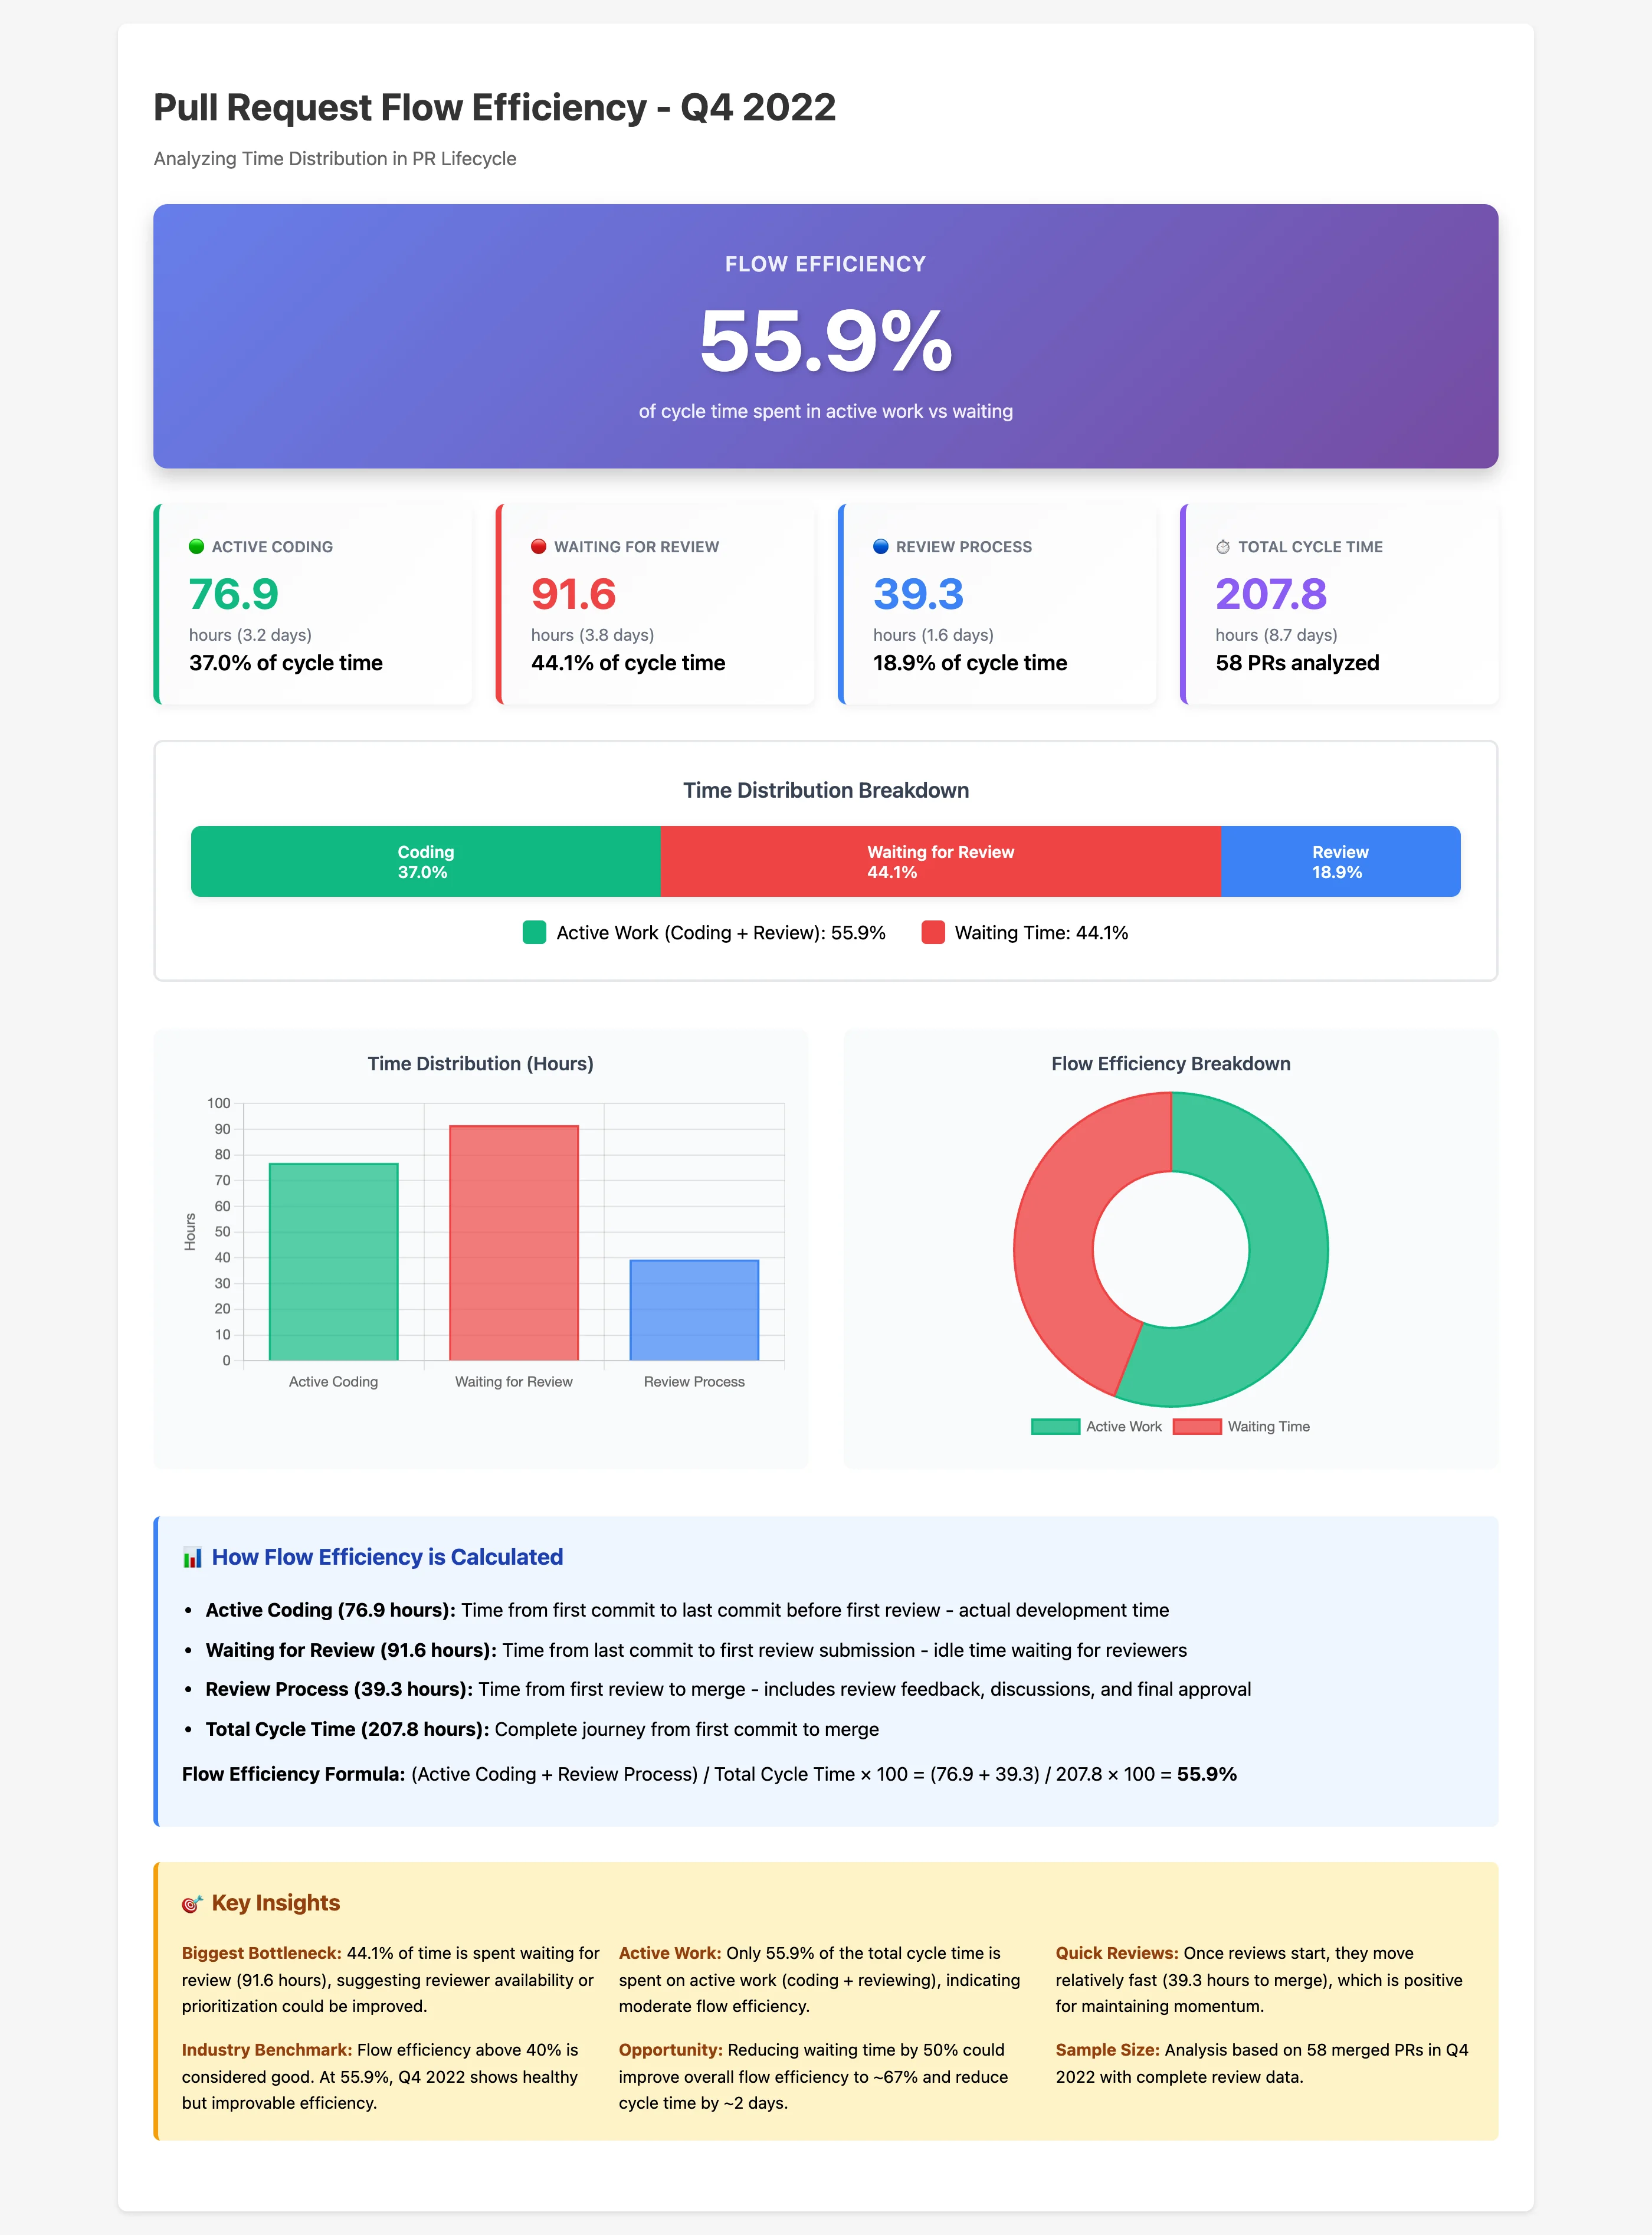
"Calculate the Flow Efficiency for Pull Requests in Q4 2022. What percentage of the total PR Cycle Time is spent in 'Waiting for Review' status versus 'Active Coding'?"
What Happened
The MCP server performed sophisticated time-series analysis:
- Calculated active coding time (first commit to last commit before review)
- Measured waiting time (last commit to first review)
- Tracked review process time (first review to merge)
- Computed flow efficiency percentage
- Generated multiple visualizations showing the breakdown
The Insight
Only 47.6% of cycle time was spent on active work, with 44.1% spent waiting for reviews. This is below the 50% efficiency threshold, indicating clear process bottlenecks. The data showed that reducing wait times by 50% could improve efficiency to 67% and cut 2 days from cycle time.
Flow Efficiency Analysis
Current State:
- Flow efficiency: 47.6% (below 50% target)
- Waiting time: 44.1% of cycle time
- Average cycle time: 16.2 days
Projected with 50% Wait Reduction:
- Flow efficiency: 67%+
- Cycle time: 8-10 days
- Developer satisfaction: ⬆️ (less context switching)
Action Item: Implement 24-hour review SLA
Use Case 4: Comparing Development Patterns Across Time Periods
"Compare the average Pull Request size (lines of code changed) from the last 3 months of 2023 to the same period in 2022, grouped by repository."
What Happened
The MCP server:
- Filtered PRs for Q4 2022 and Q4 2023
- Calculated average lines changed per repository
- Computed year-over-year percentage changes
- Generated side-by-side comparison charts
- Identified the biggest movers in both directions
The Insight
The analysis revealed dramatic shifts in development patterns:
| Repository | 2022 Avg | 2023 Avg |
| connector-github | 591 | 3,872 |
| dispatcher | 18 | 762 |
| connector-bitbucket | 668 | 155 |
These changes indicate architectural shifts, different development approaches, or changes in PR practices that warrant investigation.
Strategic Insights
Before: Year-over-year comparisons required custom data exports and Excel gymnastics
After: Instant insights into how development practices evolve, enabling strategic planning
Key Observations:
- Major architectural changes detected
- PR size philosophy shifts identified
- Repository-specific patterns revealed
Use Case 5: Comprehensive SPACE Metrics Framework Analysis
"Show me the SPACE metrics for H2 2022. Provide context, analysis and possible improvements."
What Happened
This was the most sophisticated query, where the MCP server:
- Aggregated data across 5 different dimensions (Satisfaction, Performance, Activity, Communication, Efficiency)
- Calculated 15+ metrics including throughput, cycle times, collaboration patterns
- Performed trend analysis across 6 months
- Generated a radar chart showing balance across dimensions
- Provided contextual analysis and actionable recommendations
The Insight
The SPACE analysis provided a holistic view of developer productivity:
Strengths:
- ✅ Strong throughput: 419 PRs merged (70/month)
- ✅ High activity: 3,037 commits
- ✅ Peak capacity demonstrated: 112 PRs in December
Critical Improvements Needed:
- ⚠️ Review coverage: Only 25% → Target 80%
- ⚠️ Flow efficiency: 47.6% → Target 60%+
- ⚠️ Team imbalance: 66% concentrated on one person
8 Specific Recommendations
- Mandatory Code Reviews: Increase coverage from 25% to 80%+
- Review SLA Implementation: 24-hour response time target
- Load Balancing: Distribute work more evenly across team
- PR Size Guidelines: Encourage smaller, more frequent PRs
- WIP Limits: Reduce context switching
- Automation Investment: Reduce manual review burden
- Knowledge Sharing: Cross-training to reduce single-person dependencies
- Quarterly Surveys: Track developer satisfaction metrics
Comprehensive Productivity Assessment
Before: Scattered metrics across multiple dashboards with no unified view
After: Comprehensive productivity assessment with prioritized action items
Projected Impact:
- Review coverage: 25% → 80%+
- Cycle time: 16.2 → 8-10 days
- Flow efficiency: 47.6% → 60%+
- Developer satisfaction: Measurably improved through quarterly surveys
The Technical Magic Behind the Scenes
How It Works
1. Natural Language → Structured Query
The AI assistant interprets your question and translates it into precise API calls to the Keypup MCP server
2. Smart Query Generation
The server can either execute manual queries or use AI-powered query generation for complex requests
3. Rich Dataset Access
ISSUES_PULL_REQUESTS - Issue and PR lifecycle dataREVIEWS - Code review activityCOMMITS - Code commit detailsACTIVITY_EVENTS - Temporal event streamsCOMMENTS - Discussion threads
4. Powerful Formula Engine
- Aggregations (COUNT, AVG, SUM, ROUND)
- Time operations (YEAR_MONTH, YEAR_WEEK, date math)
- Conditionals (IF, COUNT_IF, filtering)
- Array operations (FLATTEN, IN)
5. Automatic Visualization
The AI generates HTML/Chart.js visualizations tailored to the data and question type
Configuration
Setting up the Keypup MCP server is straightforward:
{
  "url": "https://hq.keypup.io/mcp",
  "headers": {
    "Authorization": "Bearer YOUR_KEYPUP_API_TOKEN"
  }
}
Once configured in your mcp.json, the server tools become immediately available to your AI assistant.
Key Capabilities Demonstrated
Through these five use cases, we've showcased:
✅ Temporal Analysis - Track metrics over time with automatic trend detection
✅ Comparative Analysis - Year-over-year, team-to-team, repo-to-repo comparisons
✅ Flow Metrics - Calculate sophisticated efficiency measurements
✅ Heatmap Visualizations - Spot patterns and outliers in 2D data
✅ Framework Support - Built-in support for SPACE, DORA, and custom frameworks
✅ Multi-Dataset Queries - Combine data from PRs, reviews, commits, and issues
✅ Actionable Insights - Not just data, but recommendations for improvement
✅ Custom Visualizations - Beautiful, interactive charts generated on-demand
From Insight to Action: The Impact
The real power of the Keypup MCP server isn't just in answering questions—it's in enabling data-driven decision-making at the speed of thought.
| Approach | Time Required | Steps |
| Traditional | 30-60 minutes | Log into dashboard → Configure filters → Export data → Create charts → Share |
| Keypup MCP | 30 seconds | Ask the question → Receive comprehensive answer ⚡ |
| Time Savings | 60-120x | Fundamentally changes how engineering leaders operate |
Real-World Applications
Organizations using the Keypup MCP server are:
📈 Engineering Managers
- Running weekly health checks on team velocity and cycle times
- Identifying bottlenecks before they impact delivery
- Making data-backed decisions in leadership meetings
👥 Team Leads
- Balancing workload across team members
- Tracking improvement initiatives (faster reviews, smaller PRs)
- Celebrating wins with concrete metrics
🏢 Executive Leadership
- Understanding engineering capacity and throughput
- Validating investment in process improvements
- Benchmarking against industry standards
🔬 DevOps Engineers
- Monitoring DORA metrics continuously
- Correlating deployment frequency with quality
- Optimizing CI/CD pipelines based on data
Getting Started
Ready to bring this level of insight to your engineering organization?
Setup Steps
- Get Your API Token: Contact Keypup to obtain your API credentials
- Configure MCP: Add the server to your AI assistant's MCP configuration
- Start Querying: Begin asking questions in natural language
- Iterate and Learn: Use the AI's suggestions to refine your queries
Example Starter Questions
"What's our PR cycle time trend over the last quarter?"
"Show me code review participation by team member"
"Calculate our DORA metrics for the last 6 months"
"Which repositories have the longest merge times?"
"How many bugs were opened vs closed each week?"
"What's our deployment frequency by environment?"
Conclusion
The Keypup MCP server represents a fundamental shift in how engineering teams interact with their data. By bringing sophisticated analytics directly into AI-assisted workflows, it eliminates the friction between questions and answers, enabling:
✨ Faster decisions based on real-time data
🔬 Deeper insights through multi-dimensional analysis
📈 Better outcomes via data-driven process improvements
😊 Happier teams who spend less time on analysis and more time on solutions
The five use cases we explored today—from cycle time trends to comprehensive SPACE metrics—are just the beginning. With natural language as your interface and the full power of engineering analytics at your fingertips, the only limit is your curiosity.
Ready to transform how you analyze engineering productivity?
The Keypup MCP server is compatible with any MCP-enabled AI assistant, including GitHub Copilot, Claude Desktop, Cursor, ChatGPT Desktop, Gemini, VSCode (with MCP extensions), Mistral AI agents, and other tools supporting the Model Context Protocol.