How to Measure Developer Productivity Without Micromanaging
Executive Summary (Key Takeaways):
- Avoid "Surveillance Metrics": Measuring lines of code or commit counts leads to burnout and "gaming the system."
- Context is King: Individual metrics are meaningless without a team baseline. Use Team Benchmarking to set realistic expectations.
- Focus on Flow and Outcomes: Use DORA metrics and the SPACE framework to understand the multidimensional nature of engineering work.
- Engineering Intelligence over Surveillance: Modern platforms like Keypup.io use AI to synthesize Git and Jira data into high-level insights, keeping the focus on unblocking teams.
The "developer productivity" debate is often polarized: managers want visibility, while developers fear the "Big Brother" effect. When productivity measurement feels like surveillance, it destroys trust and actually lowers output.
The reality? You cannot manage what you do not measure. But the most accurate way to measure productivity isn't by counting keystrokes—it's by measuring the friction in your delivery pipeline and the impact of the code being shipped.
In this guide, we explore the shift from micromanagement to Engineering Intelligence.
The Fallacy of Individual Metrics
For decades, companies tried to measure developers using "proxy metrics" like:
- Lines of code (LOC)
- Number of commits per day
- Hours spent in the IDE
The result? Developers optimized for the metric, not the product. They wrote verbose code and made tiny, meaningless commits just to "look busy."
The Antidote: Metrics in Context (Team Benchmarking)
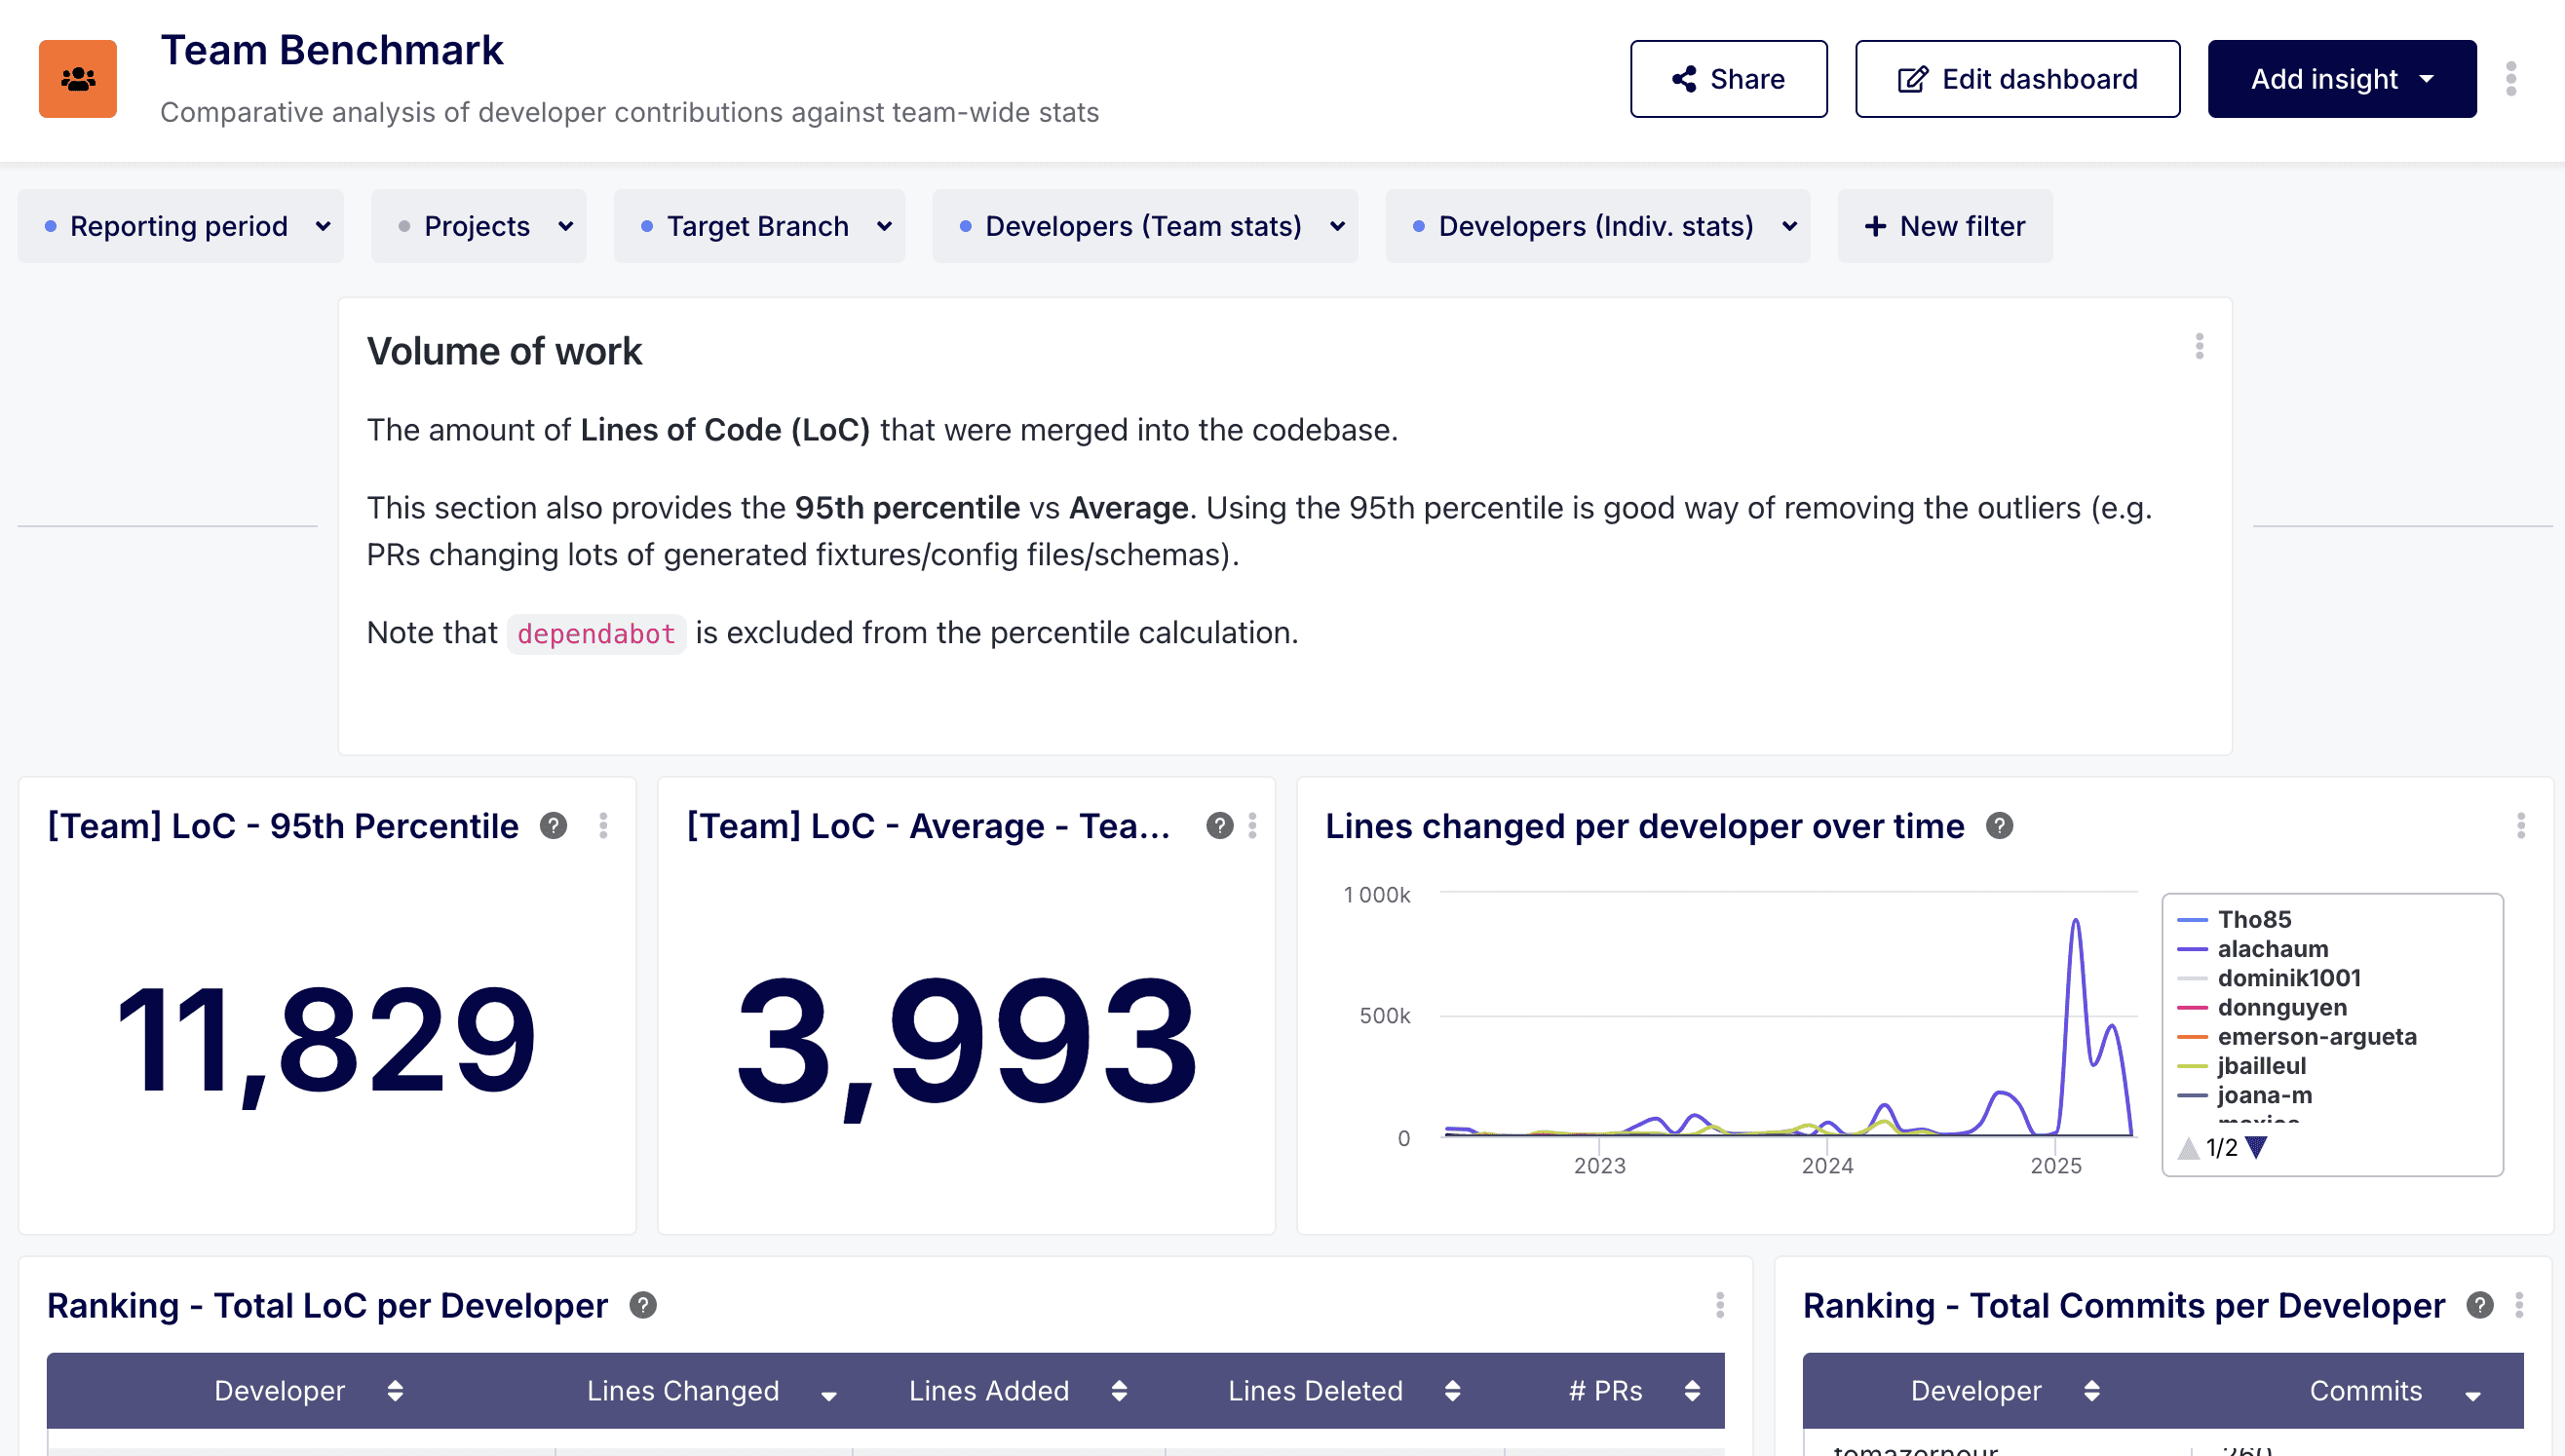
As highlighted in Keypup’s Team Benchmark Dashboard, data without context is not only useless—it’s dangerous.
To measure accurately without micromanaging, you must move from Individual Activity to Systemic Flow. Instead of asking "Why did Developer A only push 2 commits today?", you should ask: "Is the team's current Merge Time significantly higher than our historical baseline for this type of project?"
💡 The Power of Benchmarking:
Benchmarking allows you to identify "Superstar" flows vs. "At-risk" projects. By comparing current performance against the team’s own historical data, you create an objective yardstick that accounts for project complexity and technical debt, rather than unfairly comparing individuals.
The Modern Standard: DORA & SPACE
Today’s highest-performing engineering teams use two primary frameworks to measure success objectively. While DORA tells you how fast you are going, SPACE tells you how healthy the journey is.
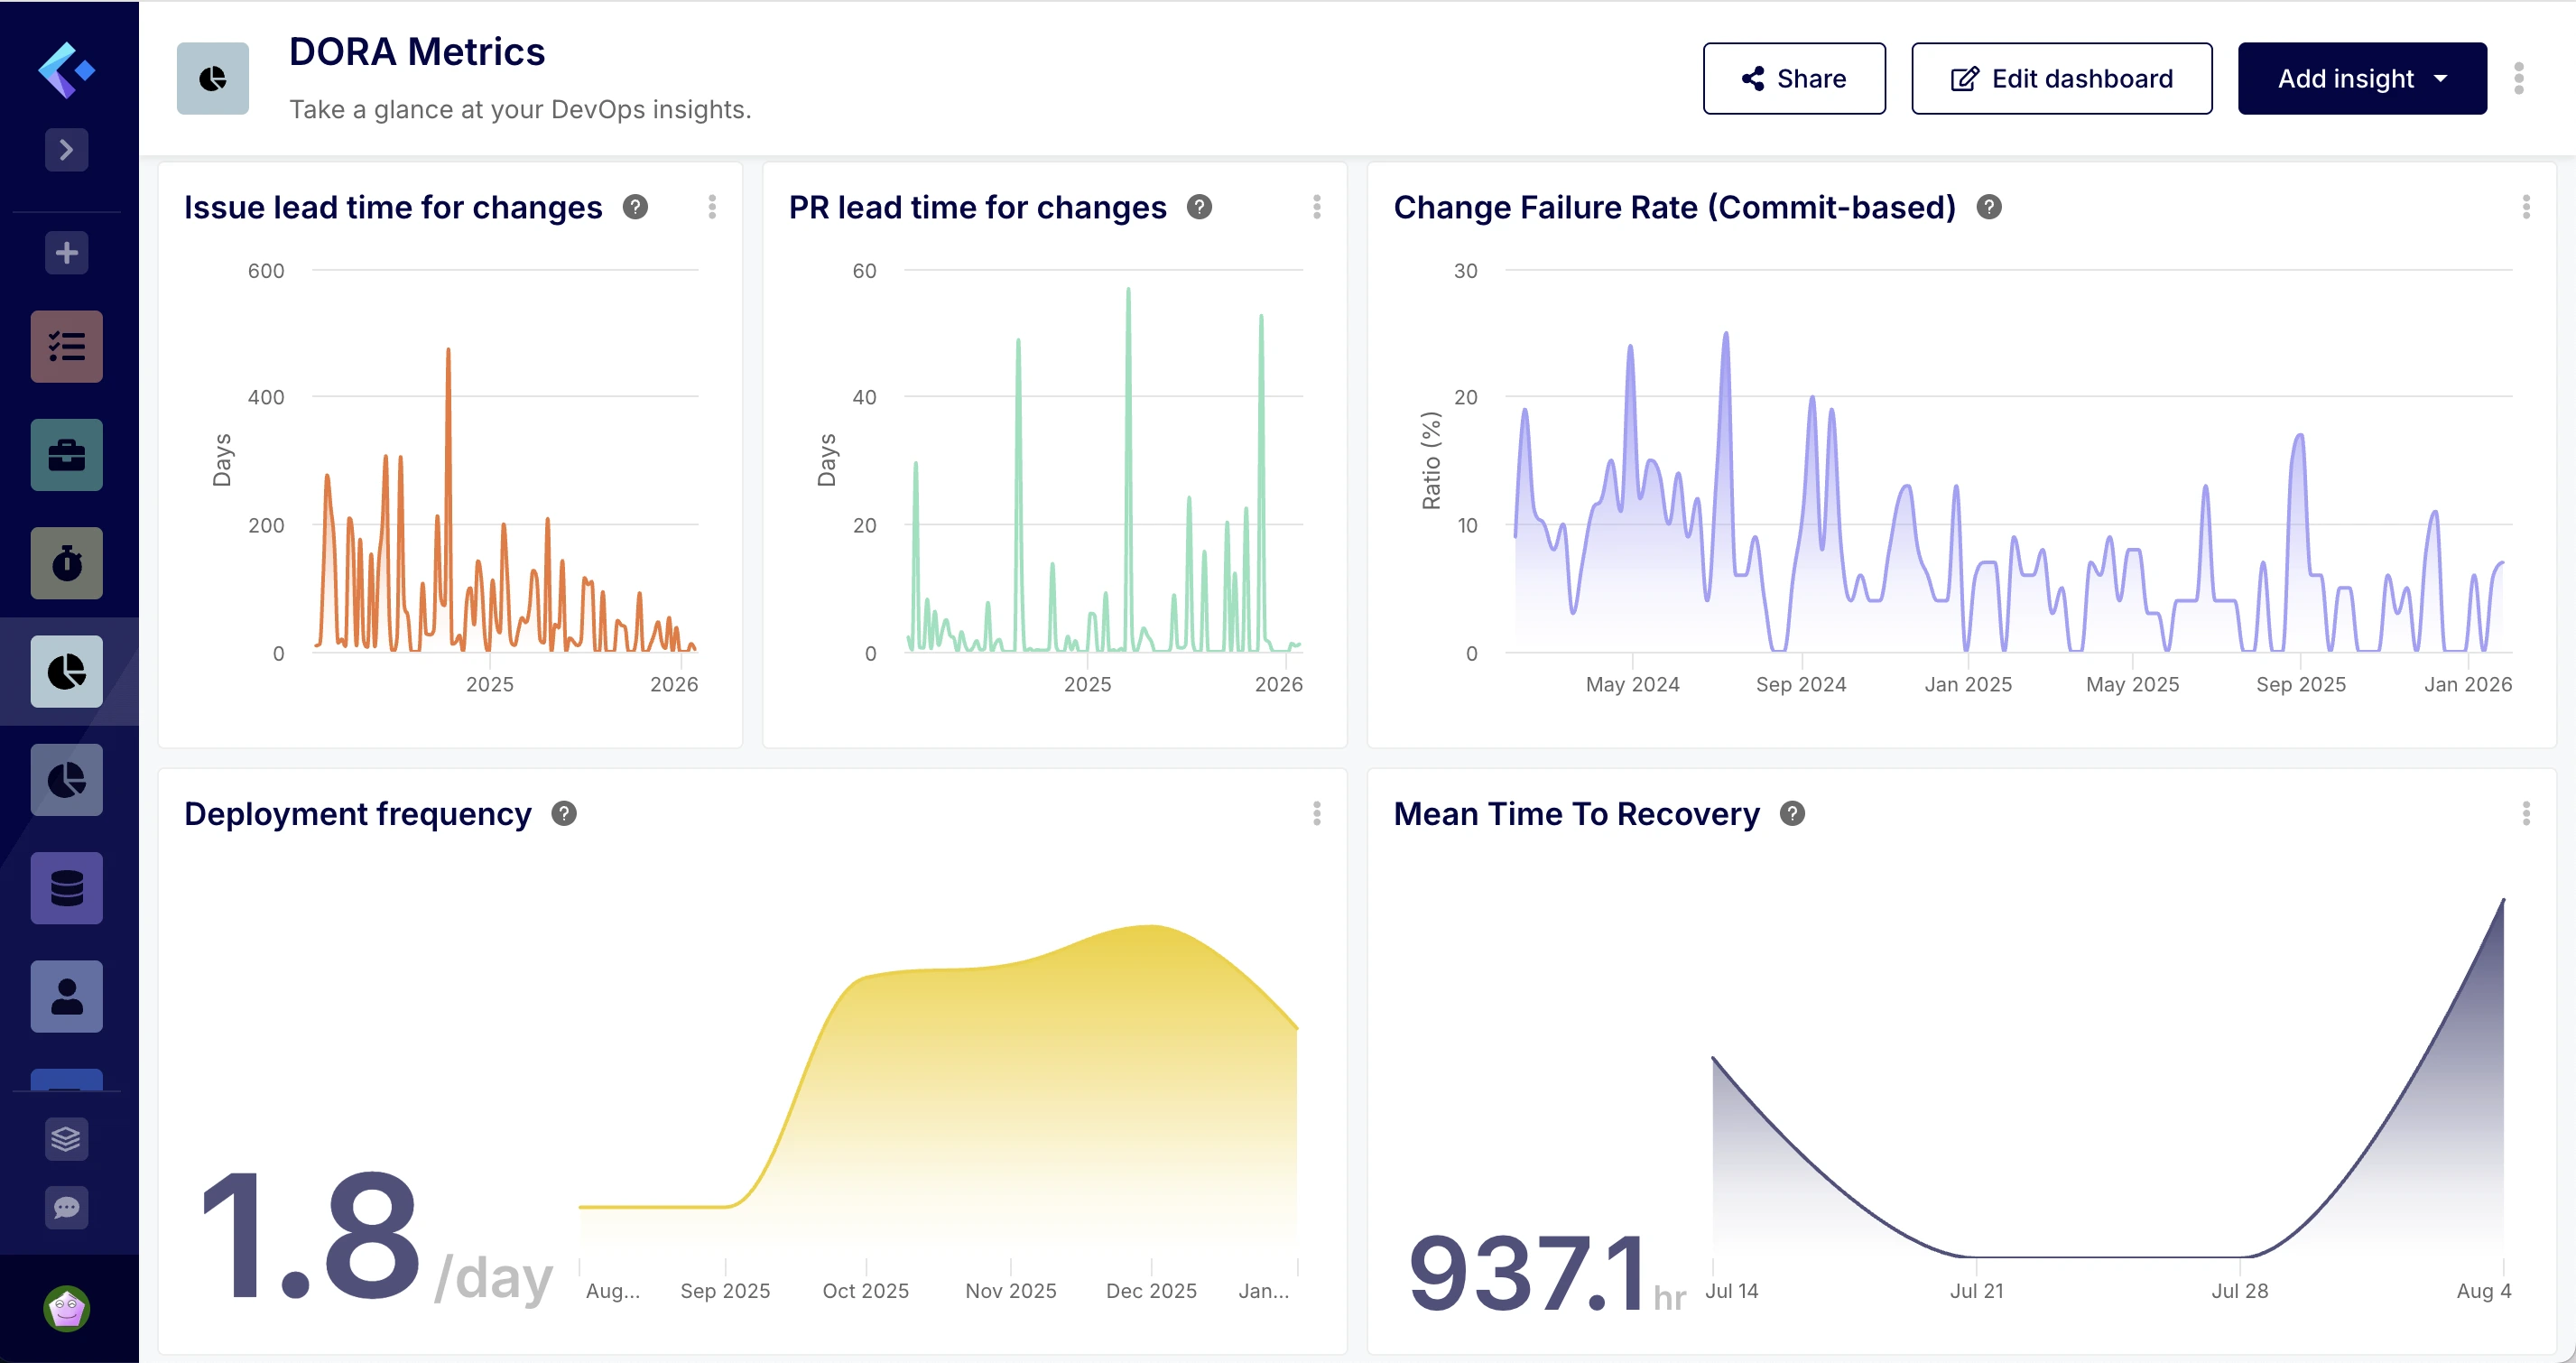
1. DORA Metrics (The Gold Standard for Flow)
Developed by Google’s DevOps Research and Assessment team, these four metrics focus on the speed and stability of the entire team.
💡 Why this avoids micromanaging:
DORA metrics are team-level. If "Lead Time for Changes" is high, it doesn't mean one developer is slow; it usually means your CI/CD pipeline is broken or your code review process is a bottleneck. It points to process issues, not people issues.
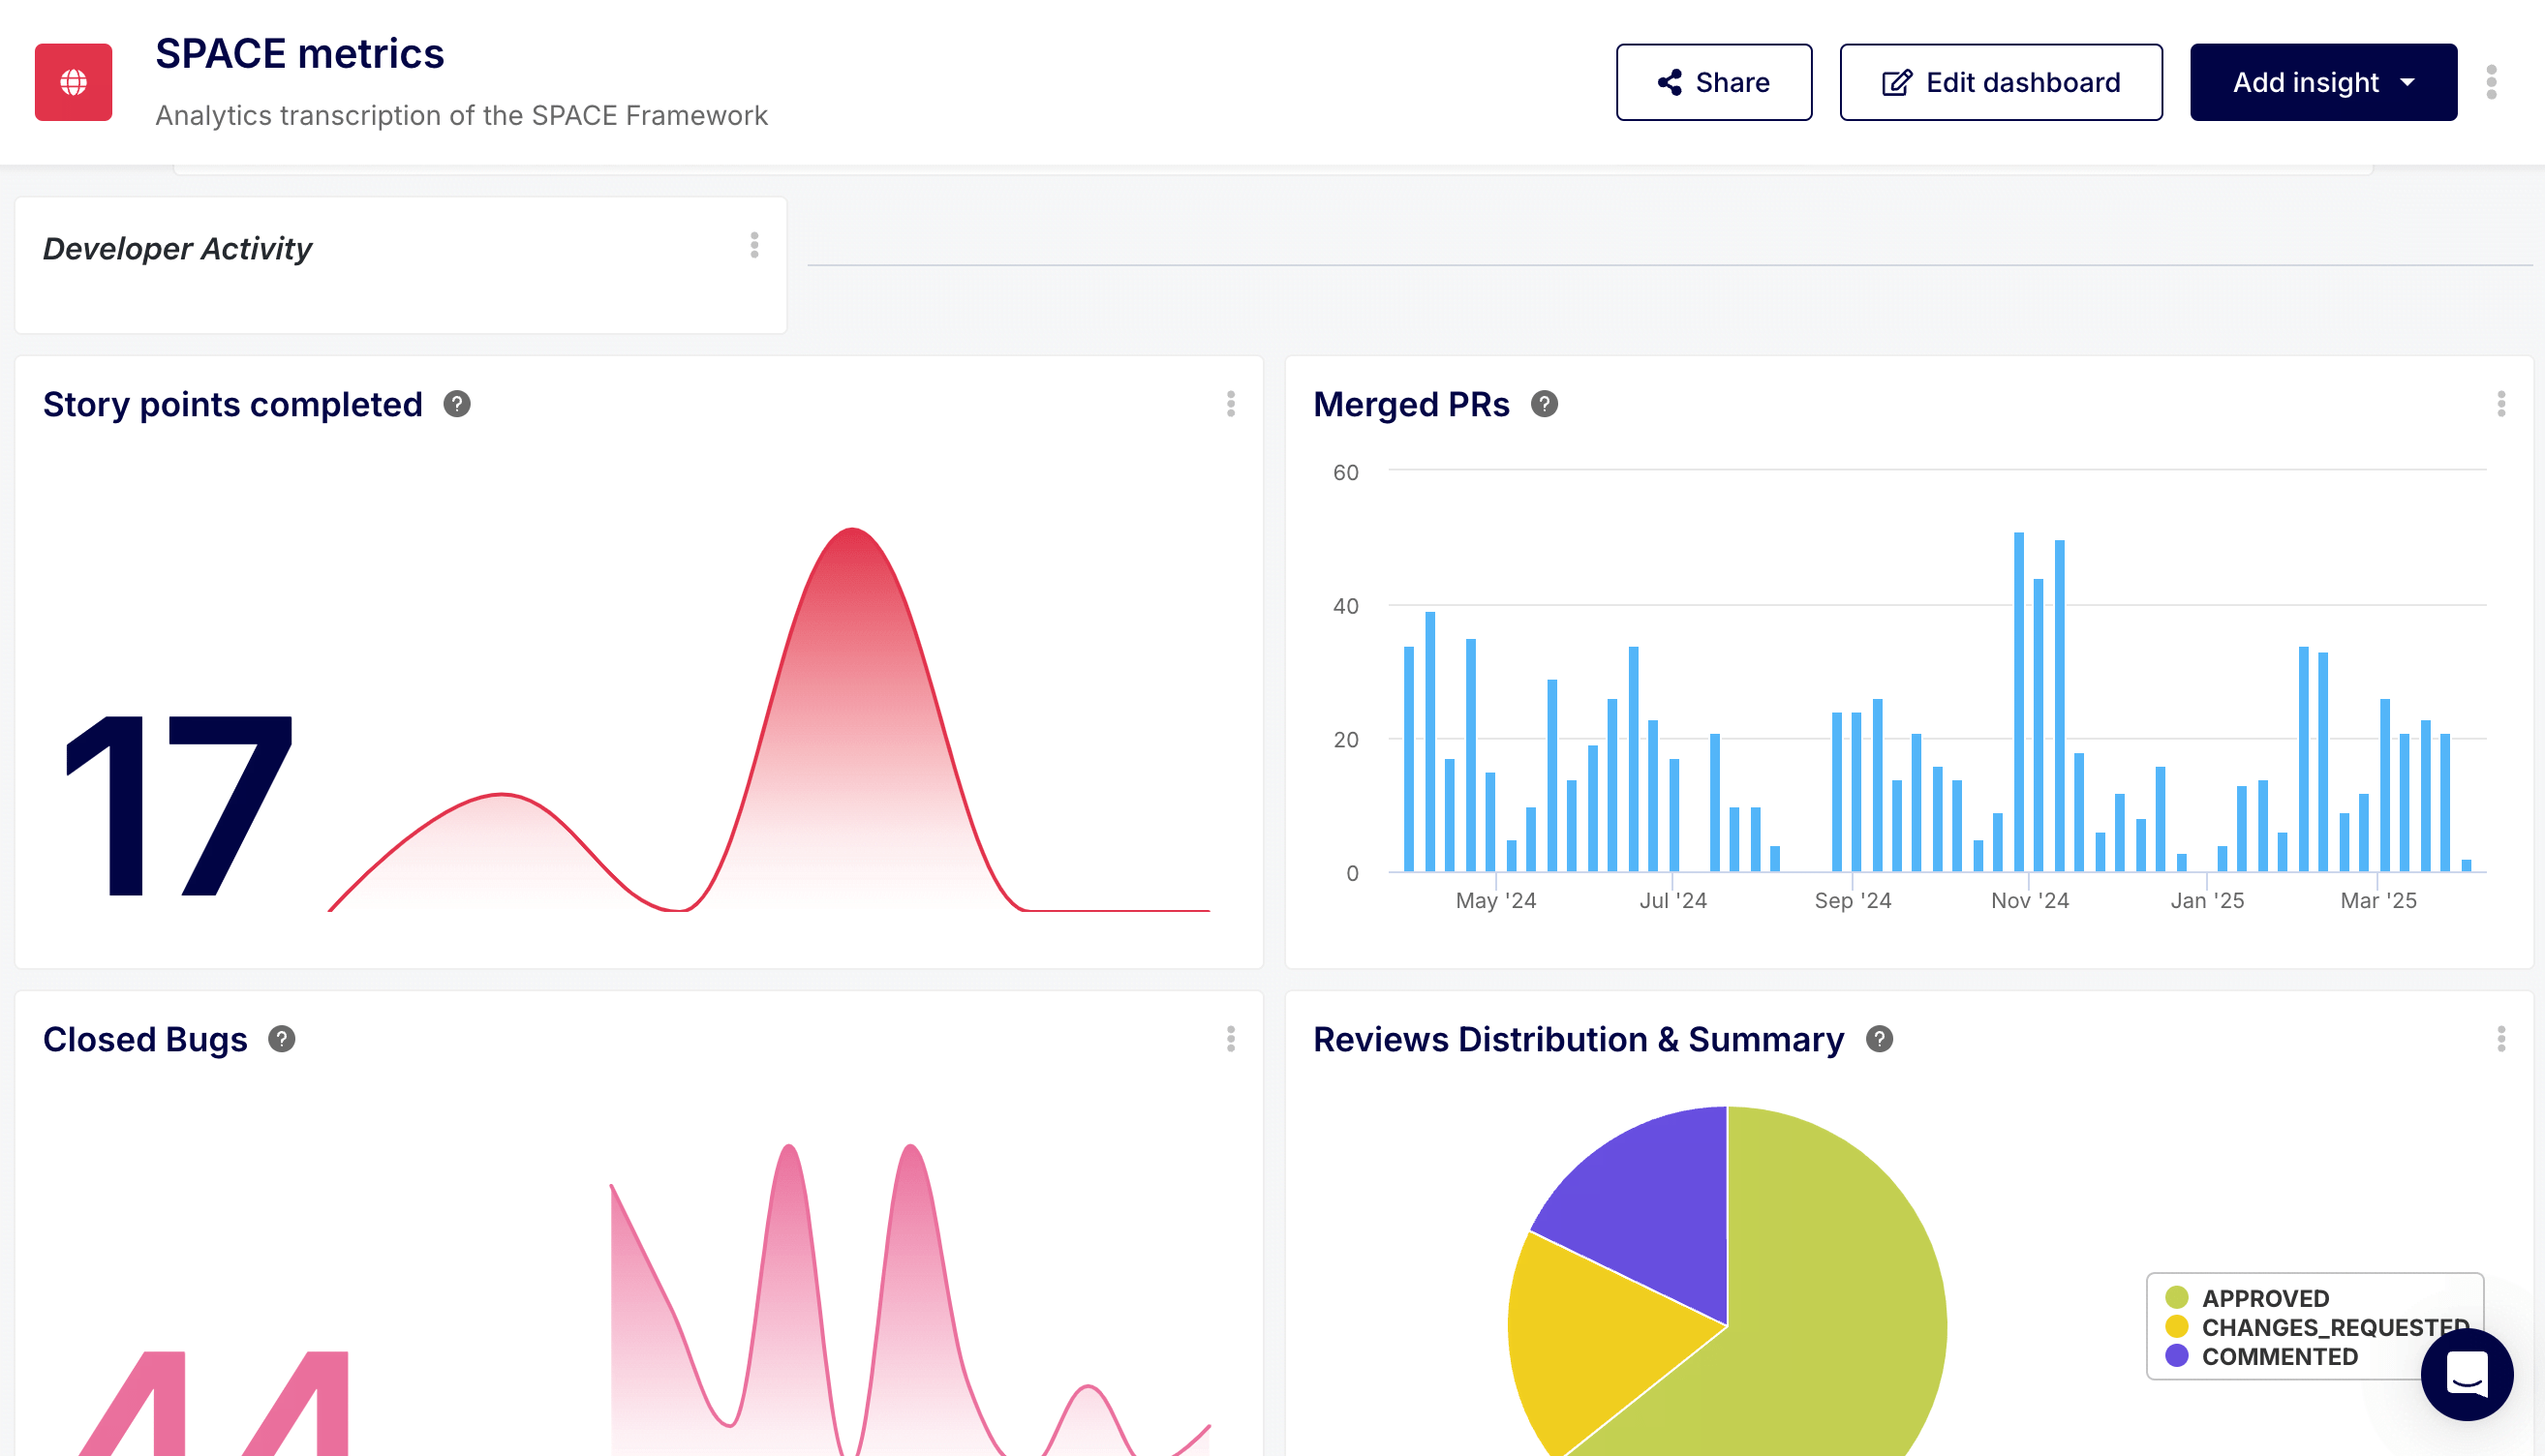
2. The SPACE Framework (The Holistic View)
The SPACE framework was designed by researchers at GitHub and Microsoft to move beyond "Activity" and capture the multidimensional nature of engineering work.
Keypup’s SPACE Analytics breaks this down into five key dimensions:
- S - Satisfaction & Well-being: Keypup tracks "Work-in-Progress" (WIP) density and after-hours work. High output with low satisfaction is a leading indicator of attrition.
- P - Performance: This focuses on outcomes. Instead of "how much code," it asks "how high is the quality?" (Measured by Change Failure Rate or Bug-to-Feature ratios).
- A - Activity: The volume of work (Commits, PRs, Jira issues). This is only one-fifth of the framework.
- C - Communication & Collaboration: Keypup measures this through PR Review Latency and the diversity of reviewers, ensuring knowledge isn't siloed.
- E - Efficiency & Flow: Does the team have "Deep Work" time? By tracking ticket transitions and PR interruptions, you can see if the process is getting in the way of the code.
3 Non-Intrusive Insights to Track Today
Using Software Development Analytics, you can surface these insights automatically without ever asking a developer for a status update.
Metric 1: Cycle Time (The Pulse of the Team)
Cycle time measures the time from the first commit to the code running in production. It is the single most important indicator of engineering health.
Metric 2: Review Latency & Collaboration
How long does code sit in "Awaiting Review"? In the SPACE framework, this measures Collaboration. If reviews take 3 days, it's a systemic failure, not a developer failure.
Metric 3: Planning Accuracy (Say/Do Ratio)
This compares what the team committed to in the sprint (Jira) versus what was actually delivered (GitHub). It measures the reliability of the process.
Using Keypup AI to Measure What Matters
The challenge with these frameworks is that the data is scattered. Keypup’s AI Agent bridges this gap by allowing leaders to query their "Engineering Intelligence" in plain English.
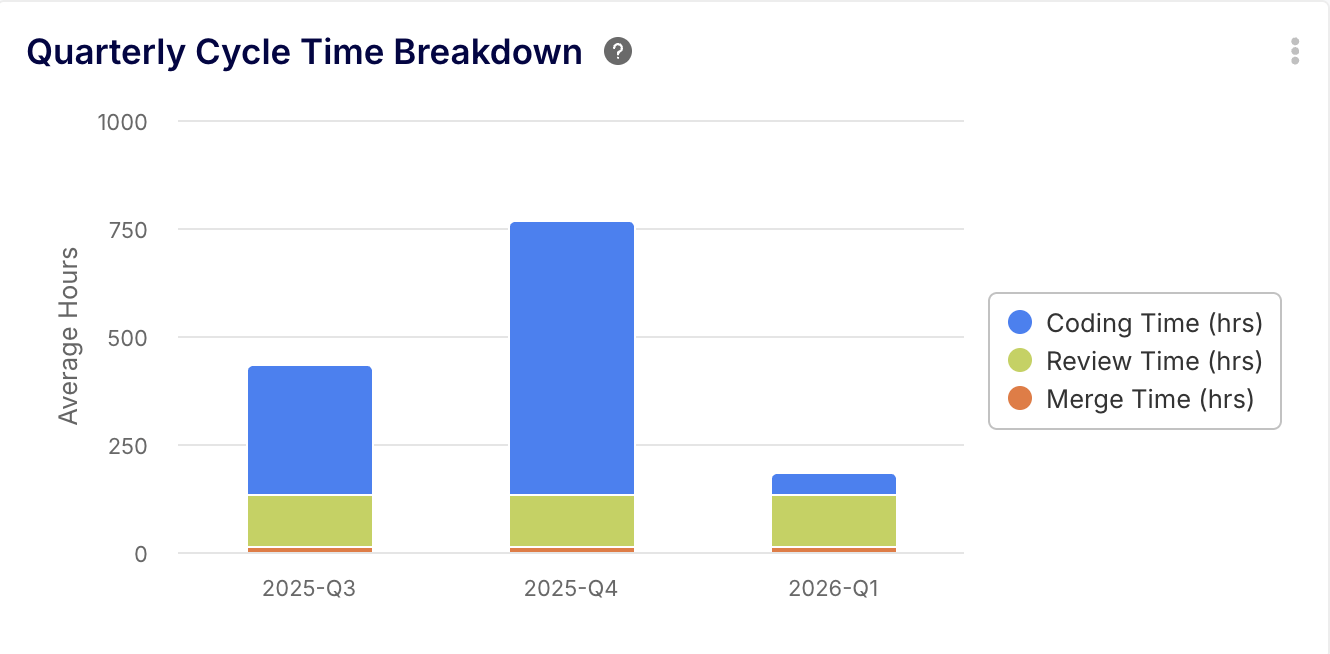
AI Prompt 1: Measuring Team Velocity
🤖 You Ask:
"What was our team's average Cycle Time this quarter compared to the last quarters?"
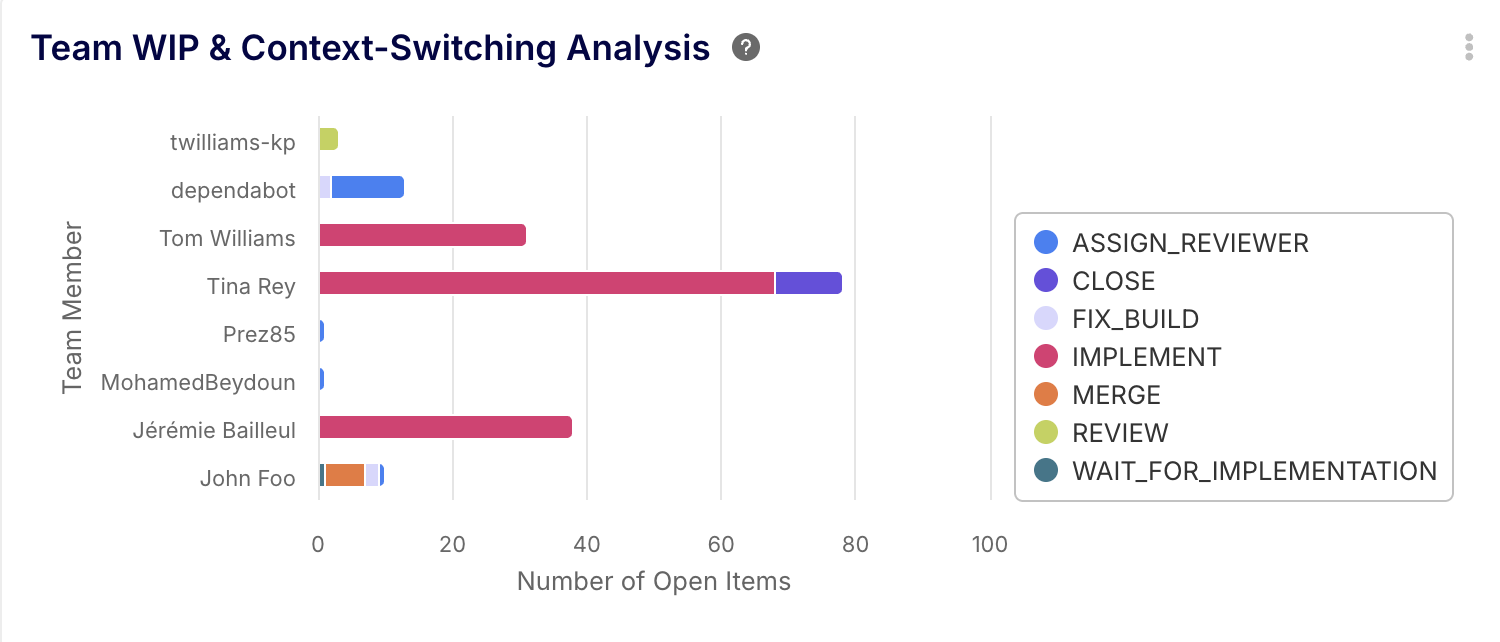
AI Prompt 2: Checking Developer "Burnout Risk"
🤖 You Ask:
"Analyze our team's WIP (Work-in-Progress) distribution and identify if anyone is potentially over-capacity or context-switching too much."
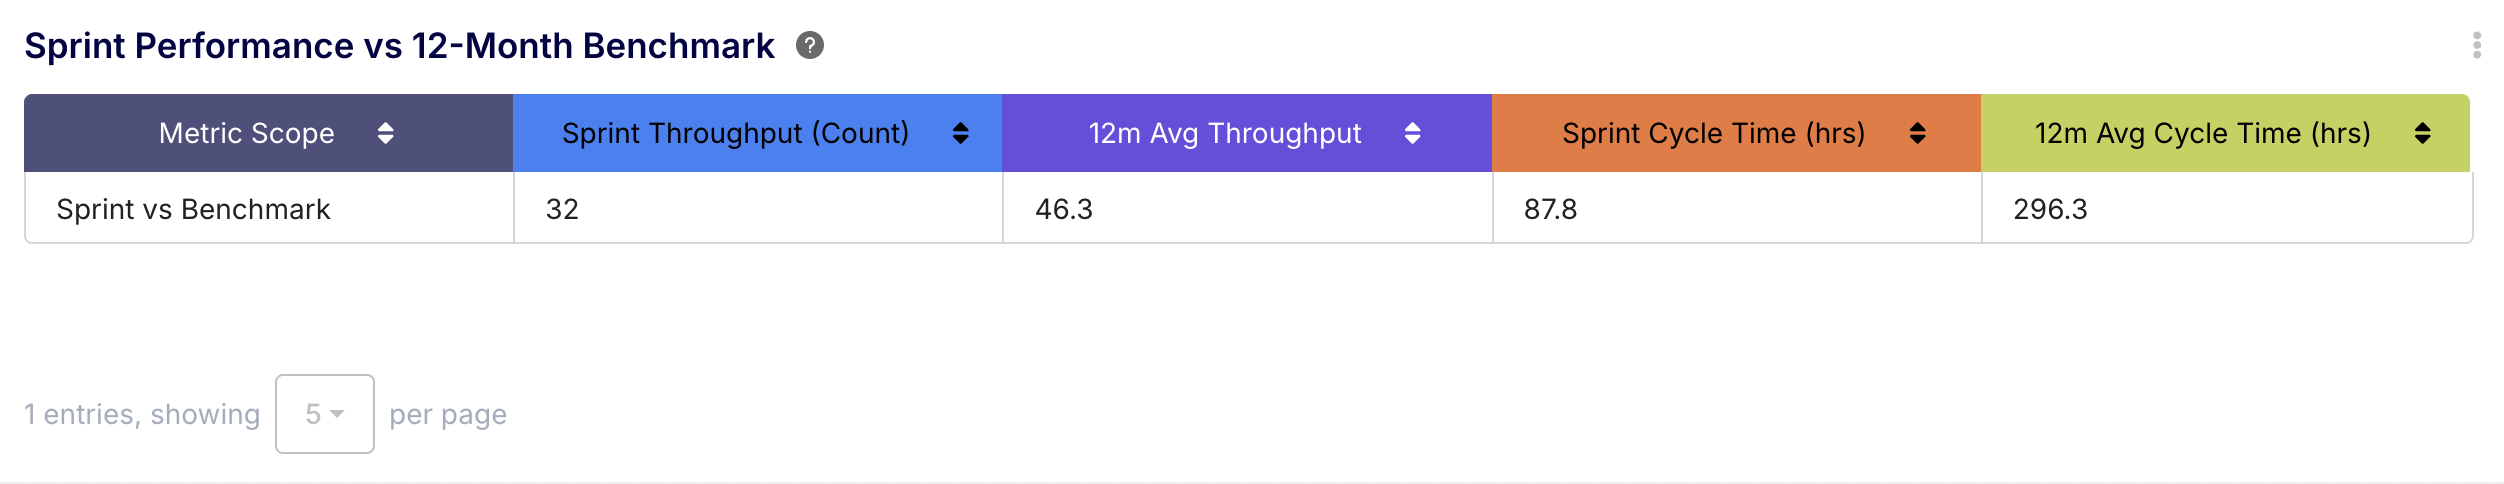
AI Prompt 3: Historical Team Benchmarking
🤖 You Ask:
"Compare our current Sprint throughput and Cycle Time against our team's average for the last 6 months. Are we performing above or below our benchmark?"
The Keypup Insight: This provides the context managers need to know if a slow week is a sign of a deeper issue or just a natural fluctuation based on project complexity.
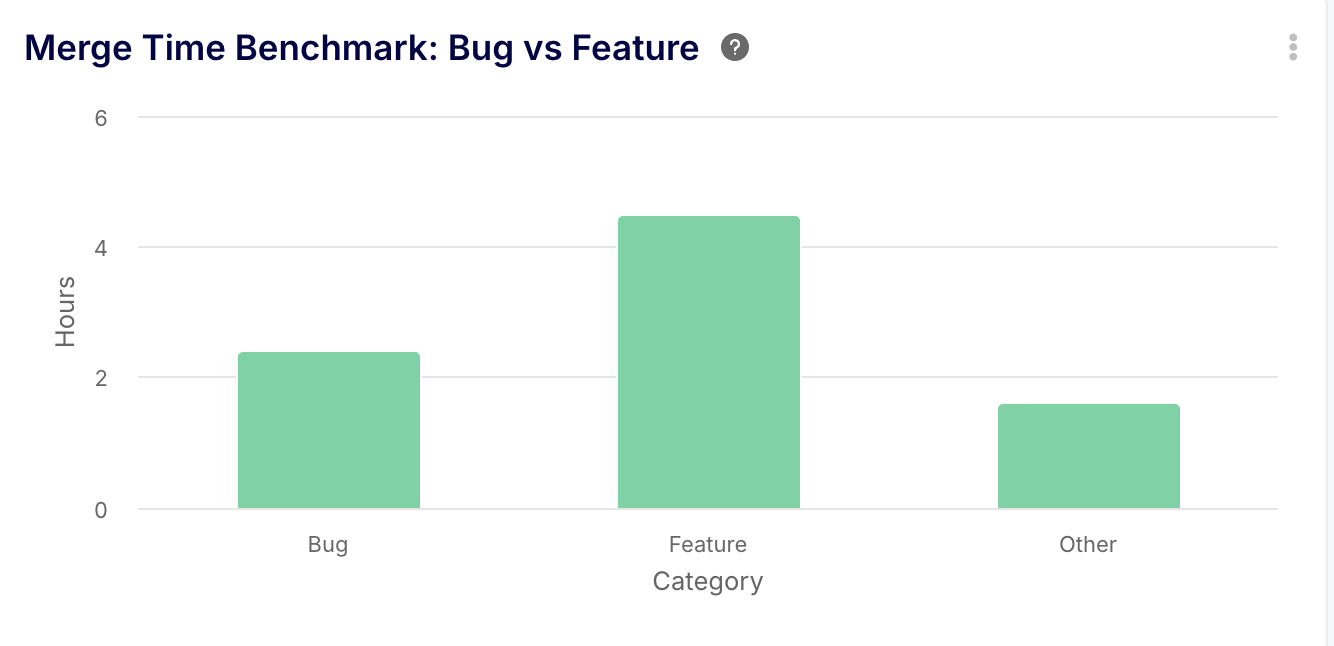
AI Prompt 4: Contextual Quality Benchmarking
🤖 You Ask:
"Break down our Merge Time benchmark by 'Bug' vs 'Feature' tickets. Are bugs taking longer to merge than our standard baseline?"
The Keypup Insight: This allows you to identify if technical debt (bugs) is becoming more "expensive" to manage than building new features, helping you justify a "cleanup sprint" to stakeholders.
Conclusion: Productivity is a Resource, Not a Target
The most accurate way to measure developer productivity is to stop treating developers like factory workers and start treating the delivery pipeline like a complex ecosystem.
By focusing on Flow Efficiency, Team Benchmarking, and the holistic dimensions of the SPACE framework, you gain the visibility you need to satisfy the business, while giving your developers the autonomy they need to build great software.
Ready to see your team's real impact? Explore Keypup's Team Benchmark Dashboard and let our AI Agent show you where your team is shining—and where they need your help to unblock.