Customizing engineering metrics can be a game-changer for software engineering organizations. By creating custom formulas, you can tailor engineering metrics and reports to fit the unique needs and goals of your organization, providing more accurate and meaningful insights that help you make informed decisions and improvements. In this tutorial, we'll show you how to modify engineering metrics using Keypup's custom formula feature.
Keypup provides a variety of templates for engineering metrics, reports, and KPIs that you can easily adjust to best suit your needs. The templates are built using custom formulas, but we recognize that not all software engineering organizations are equal, so we haven't hardcoded them. This means you can easily modify the provided templates to create custom engineering metrics and reports without having to start from scratch.
In this tutorial, we'll use the example of modifying the PR Lead Time for Changes metric to show you how to use Keypup's custom formula feature. The initial calculation provides the average time (expressed in days) from creation date to merge date of all pull requests (PRs). We're going to change this calculation to evaluate the average time from the first commit date to the merge date instead.
Here are the steps to modify the engineering metric using Keypup's custom formula:
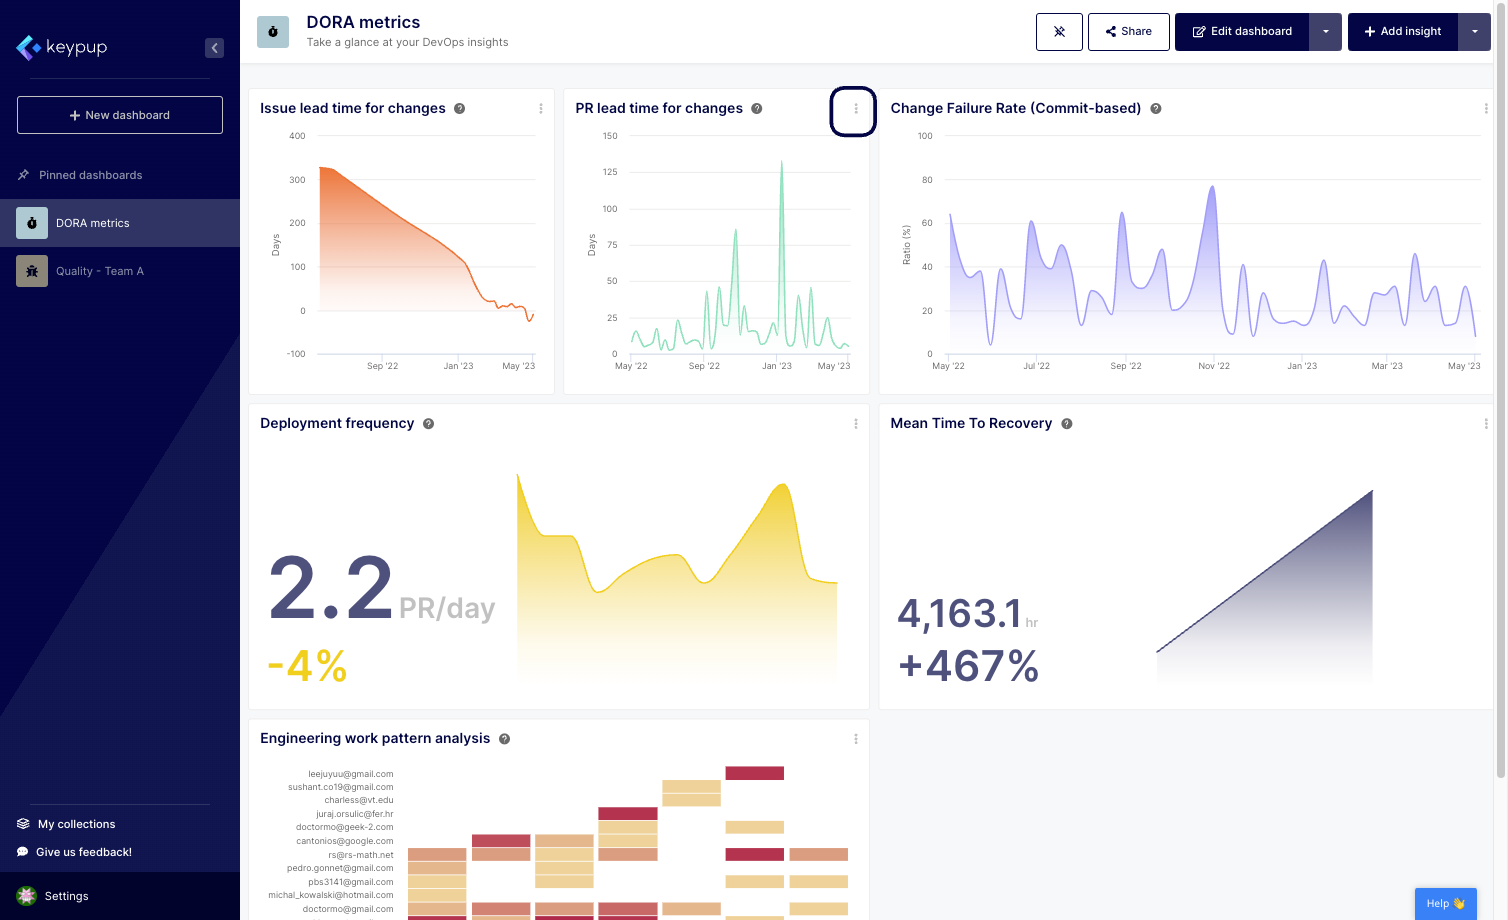
1. Select the insight you want to modify by clicking on the edit button located on the top left of the insight. In this case, we're modifying the PR Lead Time for Changes metric.
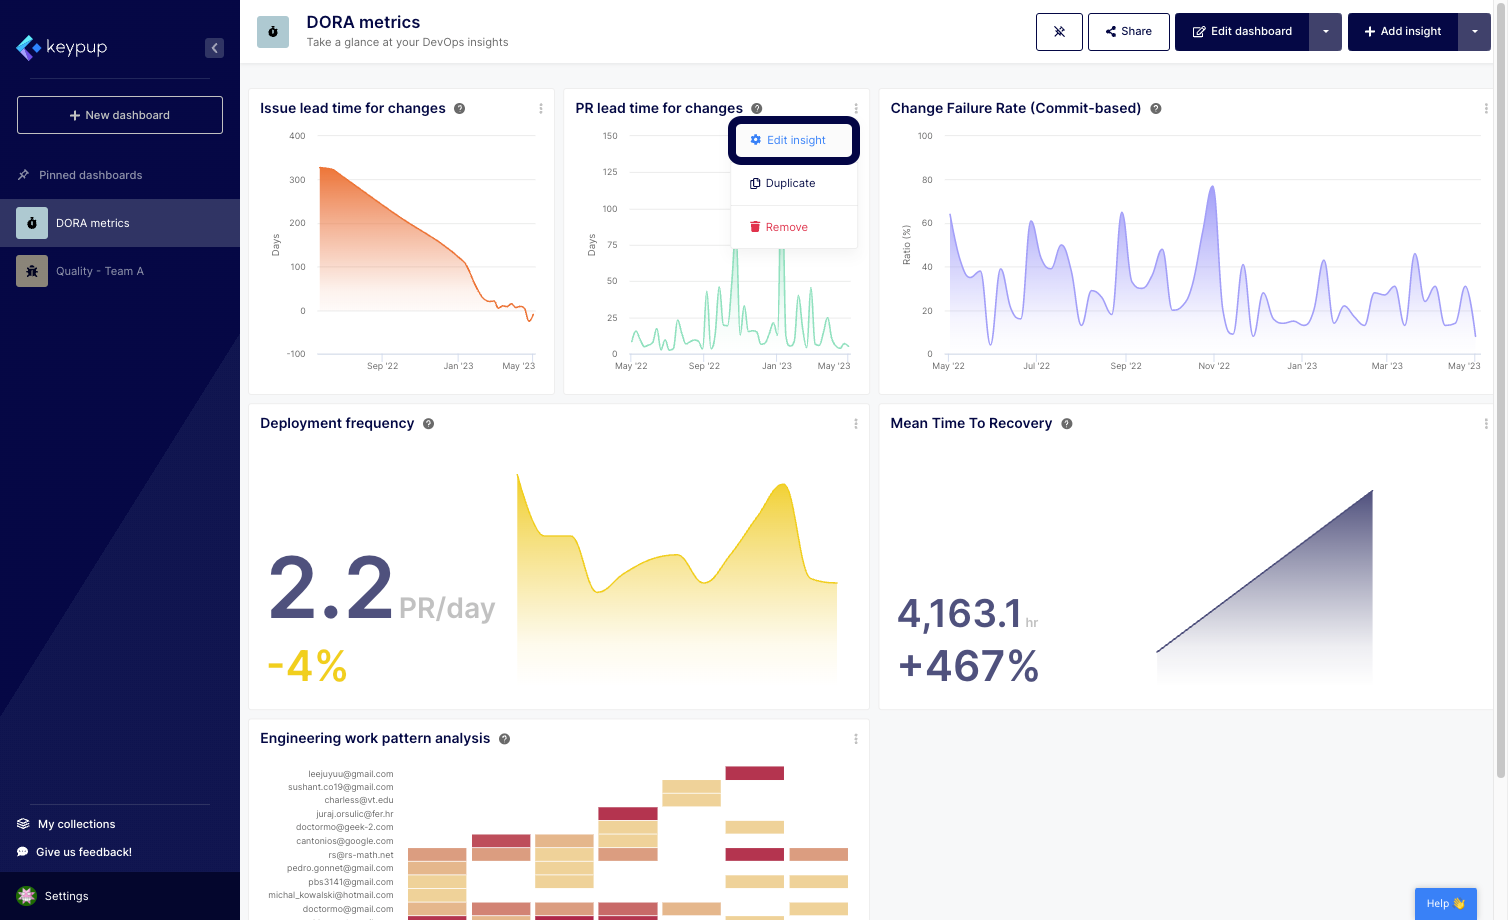
2. Select "Edit insight" from the dropdown menu.
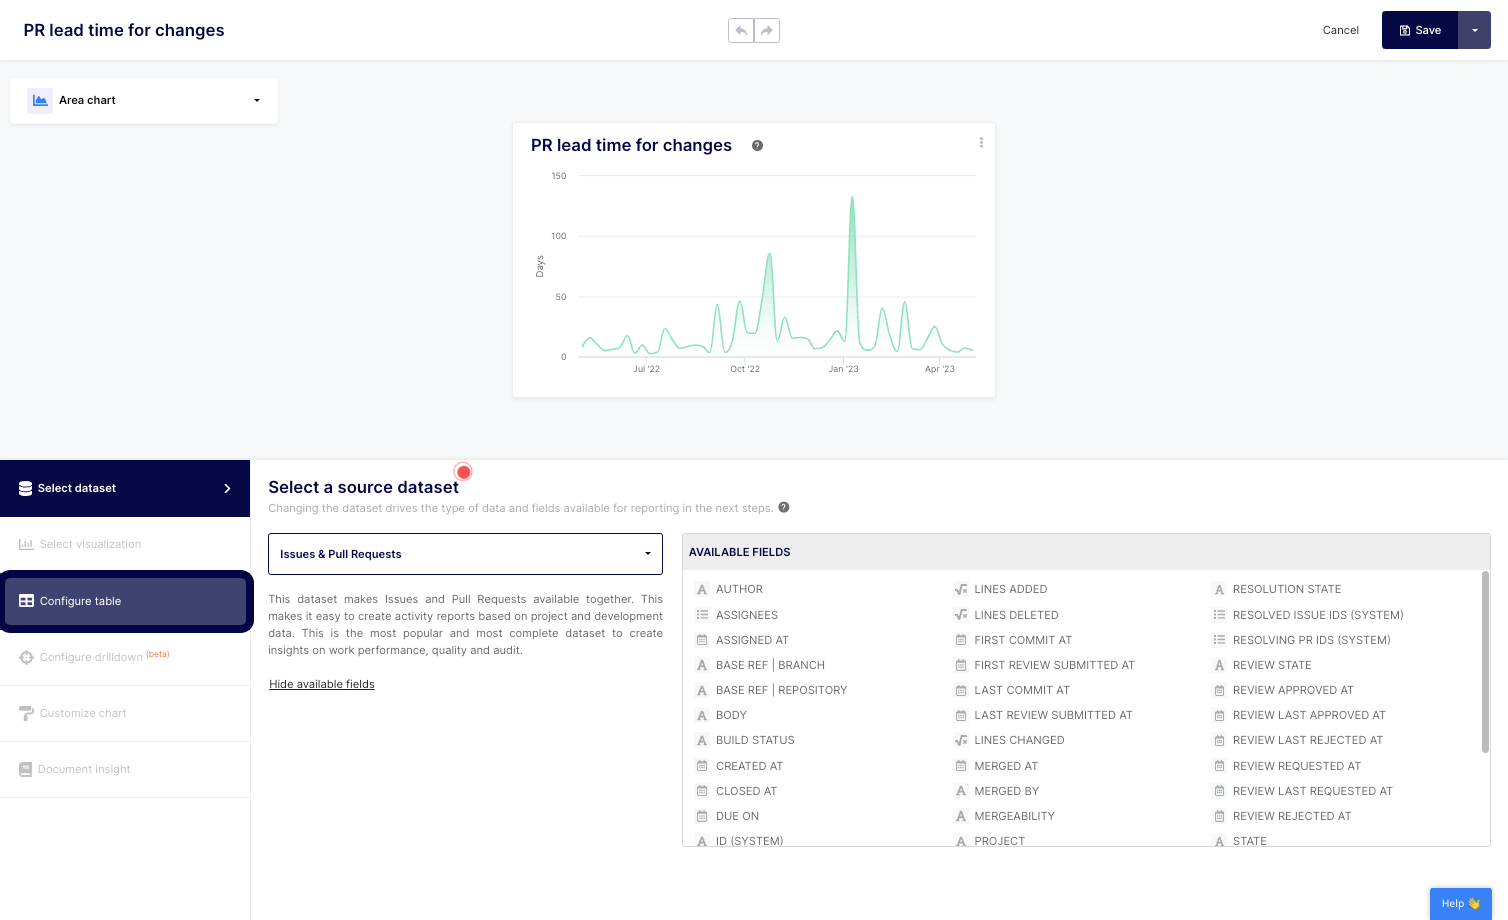
3. On the configuration panel located on the left side of your screen, select the "Configure table" option.
4. Enlarge the "Custom formula" section in the metric column.
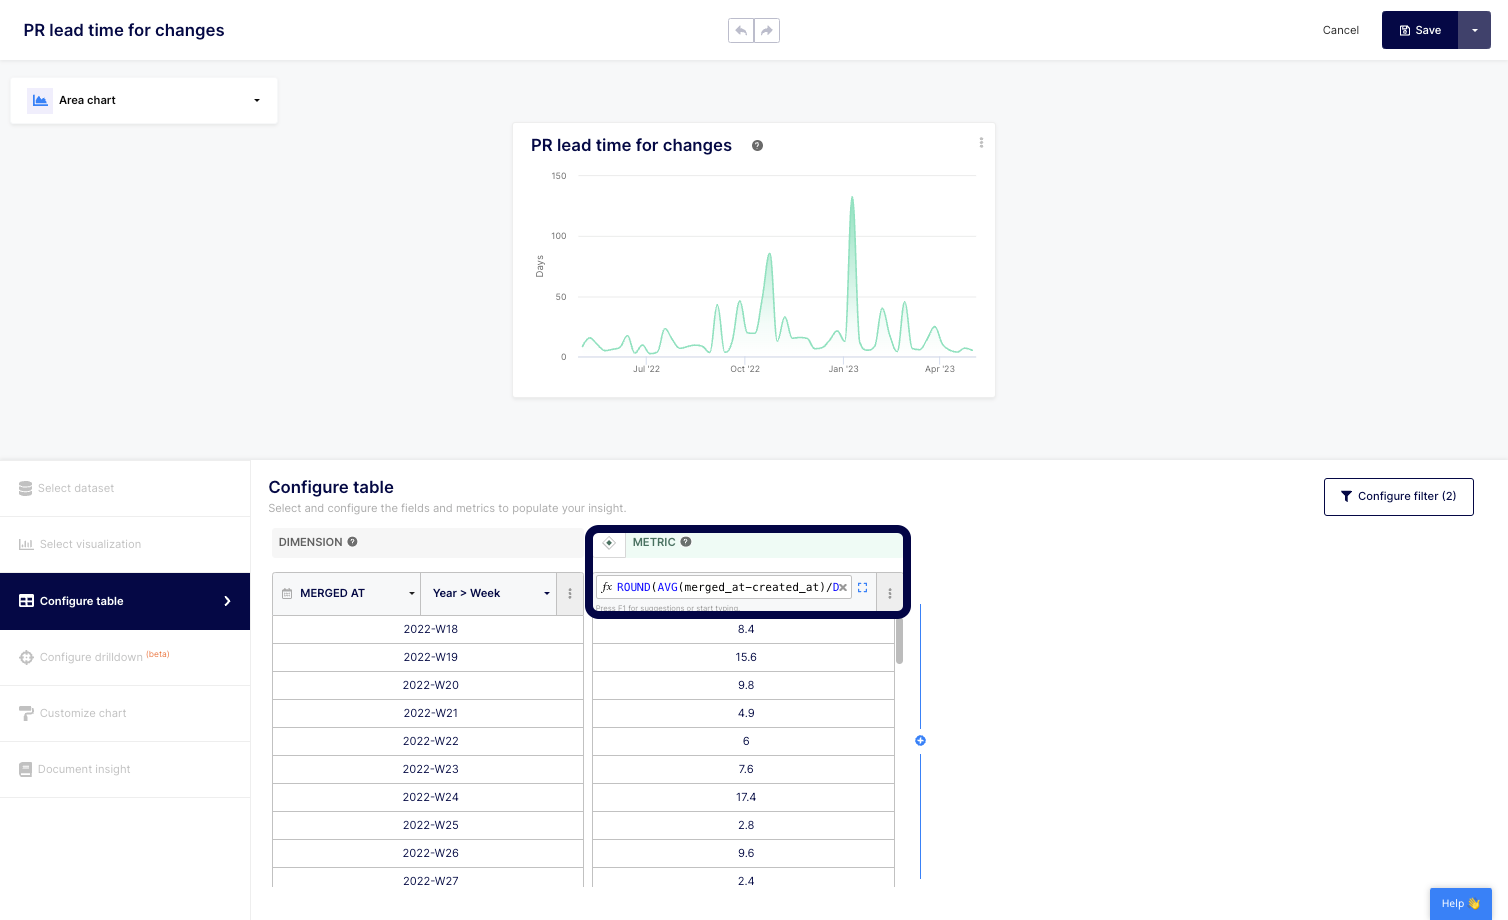
5. Edit your formula. In this case, we're going to modify the "created at" field to the "first commit at" field. As you type, Keypup provides you with a list of available fields to choose from.
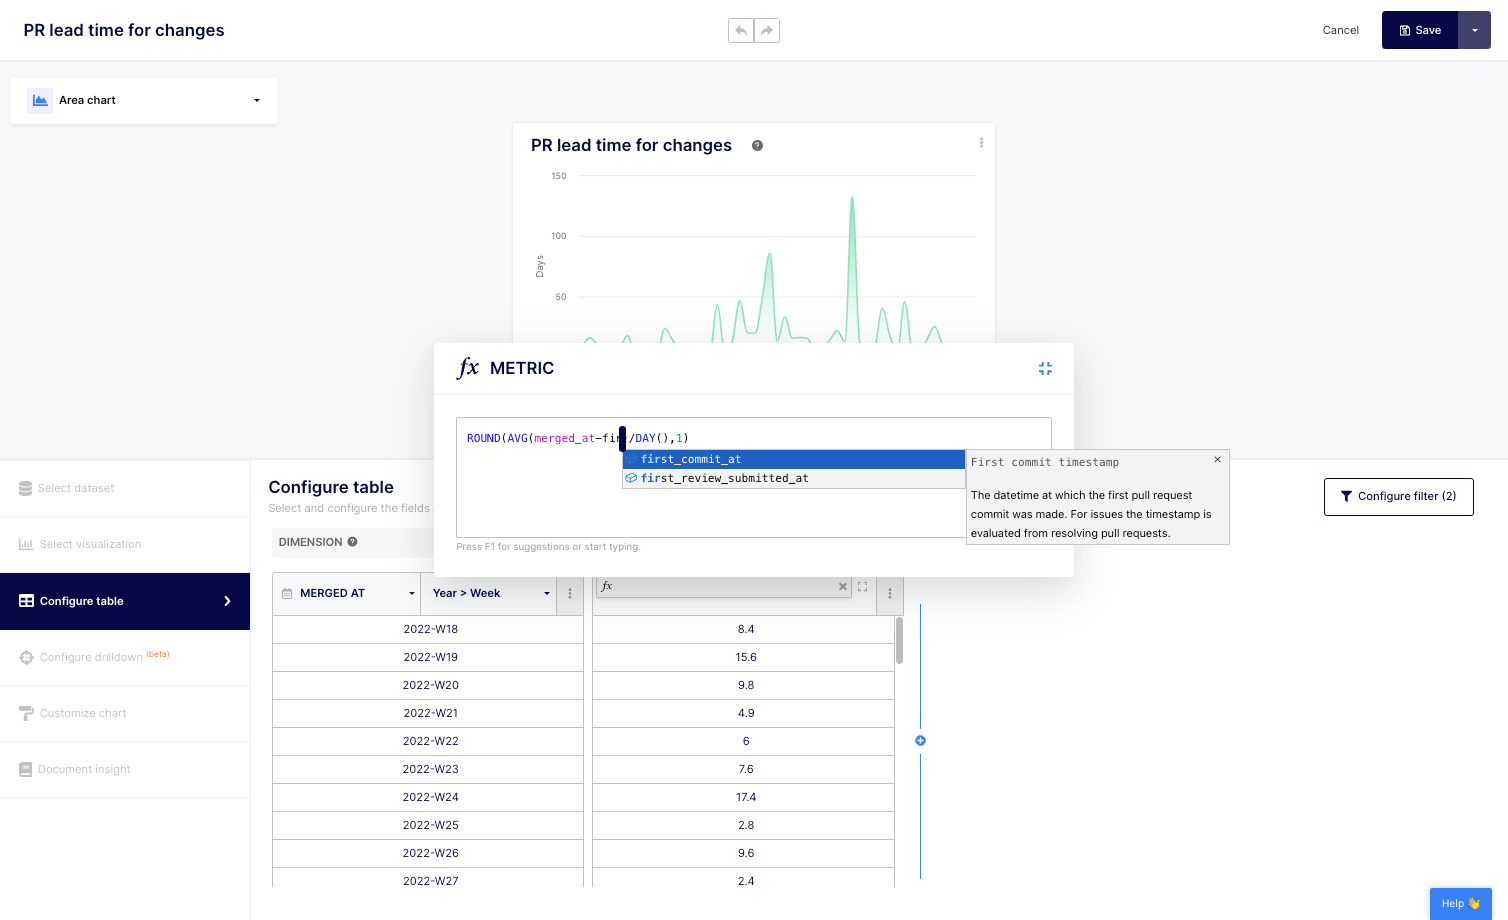
6. Select your field, in this case: "first_commit_at".
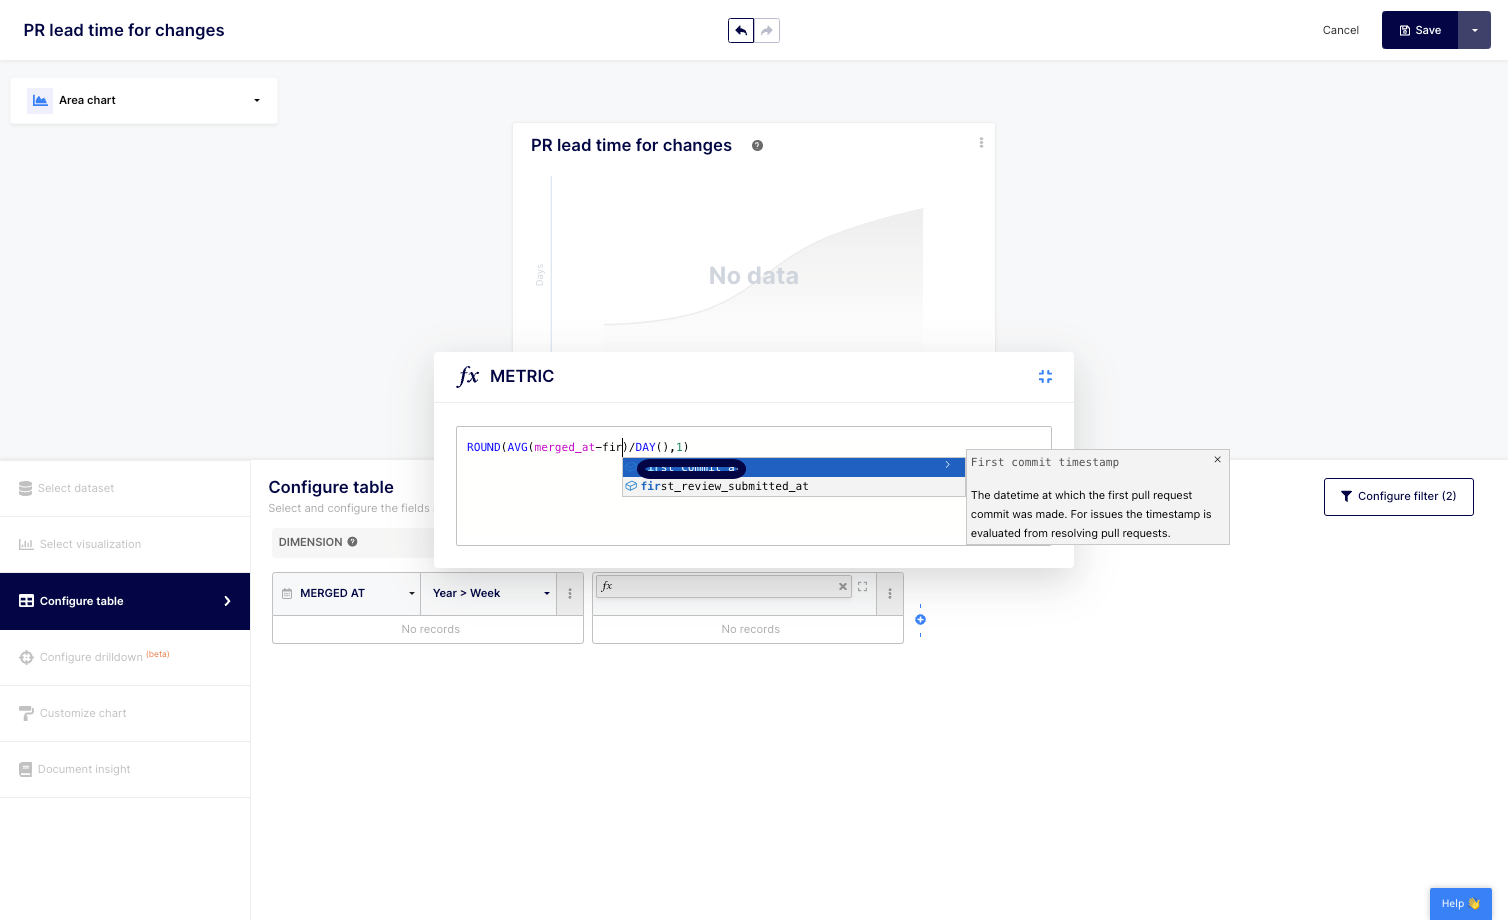
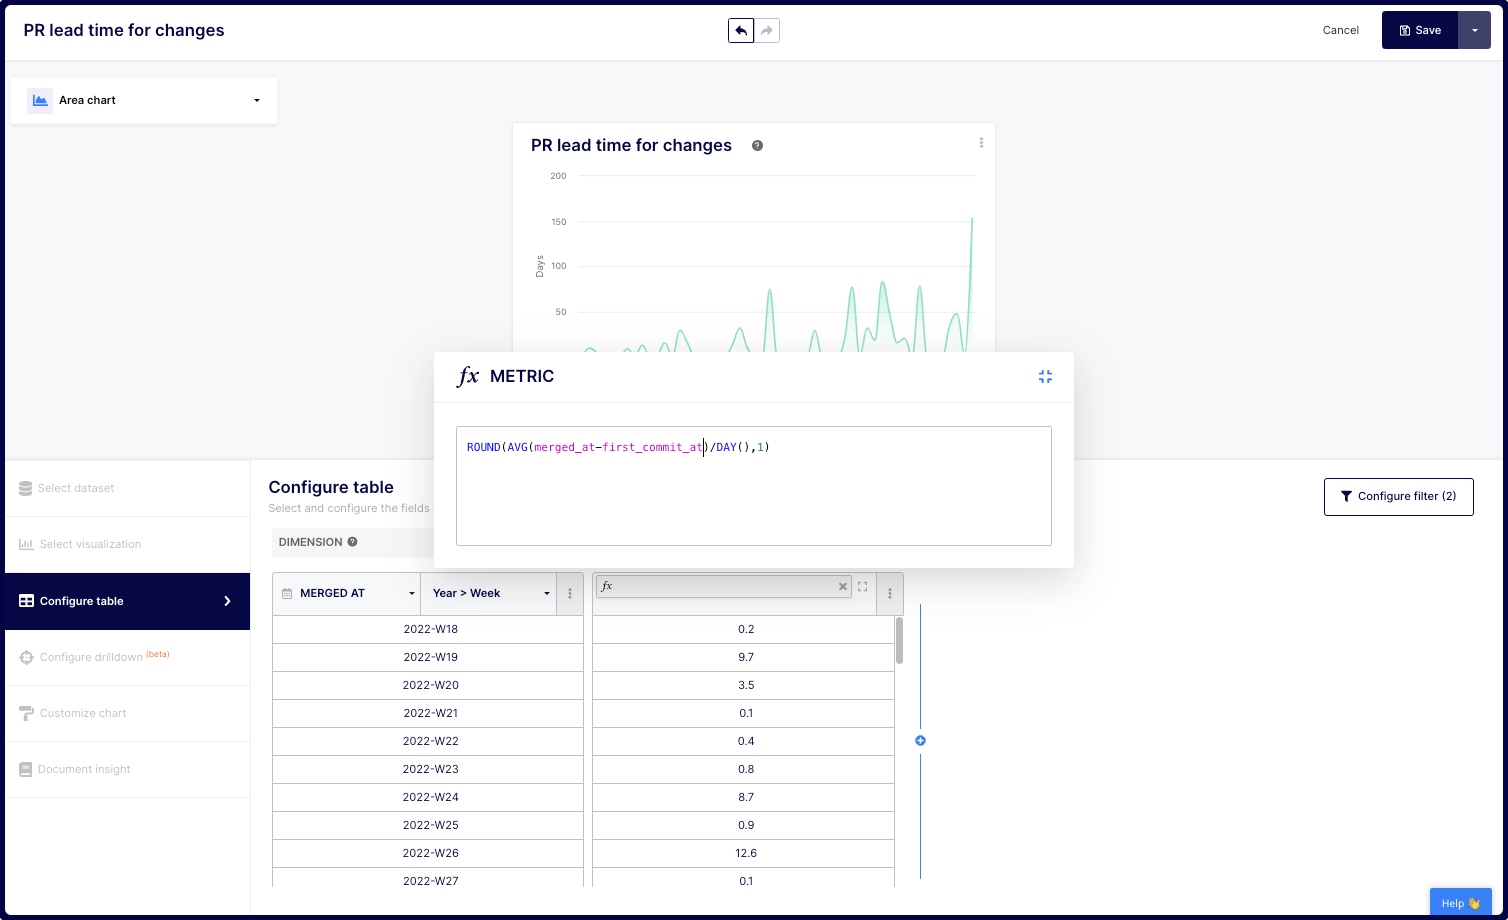
7. You have now modified the starting point of the PR Lead Time for Changes calculation from creation date to first commit date.
8. Click on "Document insight" on your left navigation panel.
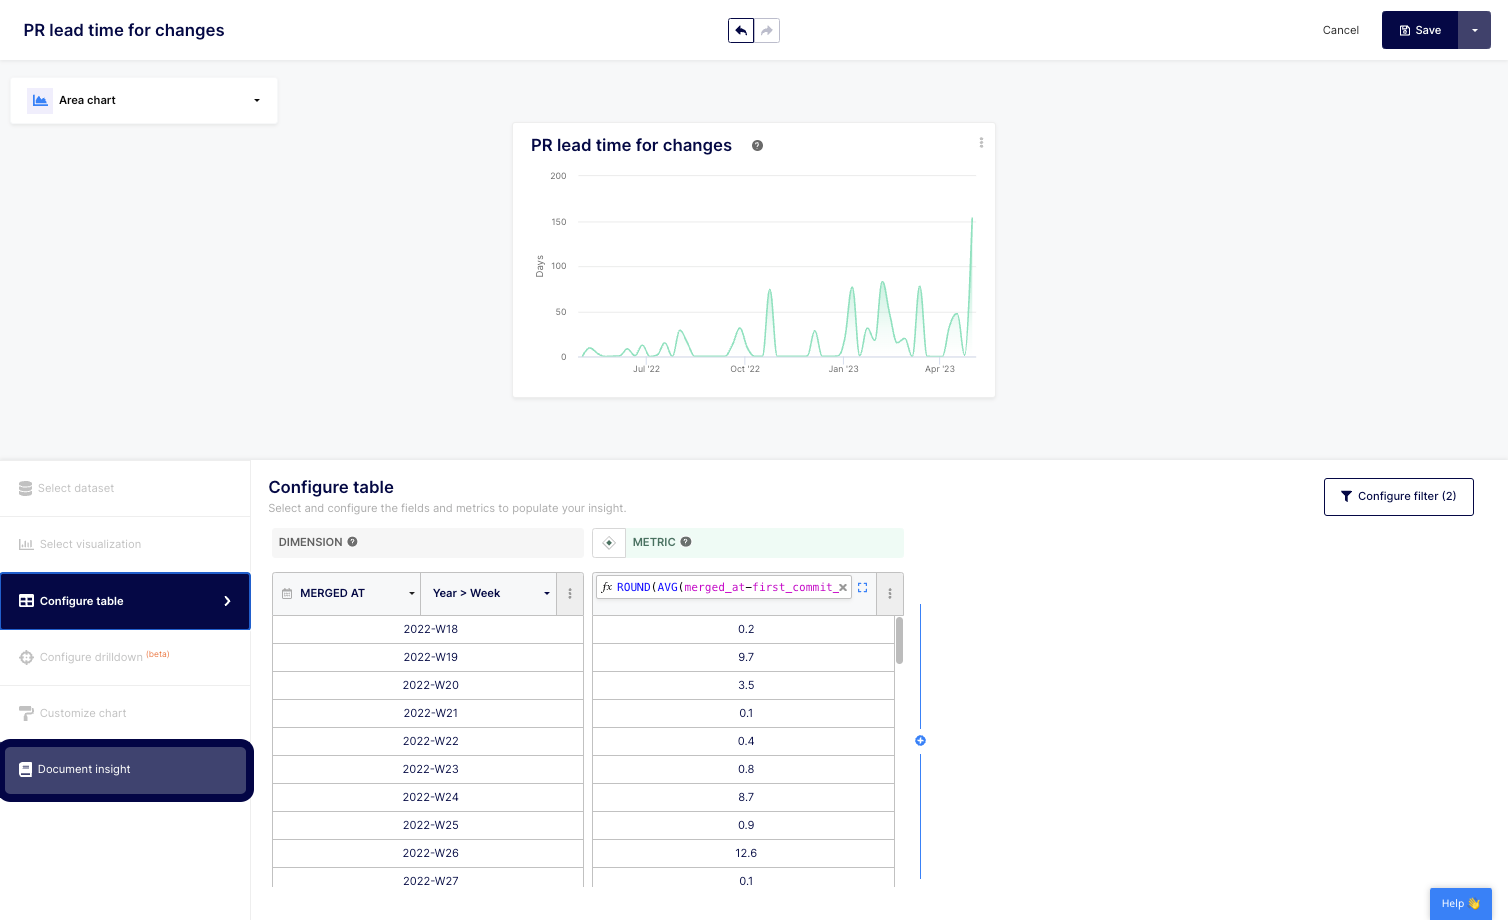
9. Modify your insight documentation to best reflect your changes. In this case, we replaced the calculation starting point to reflect our change.
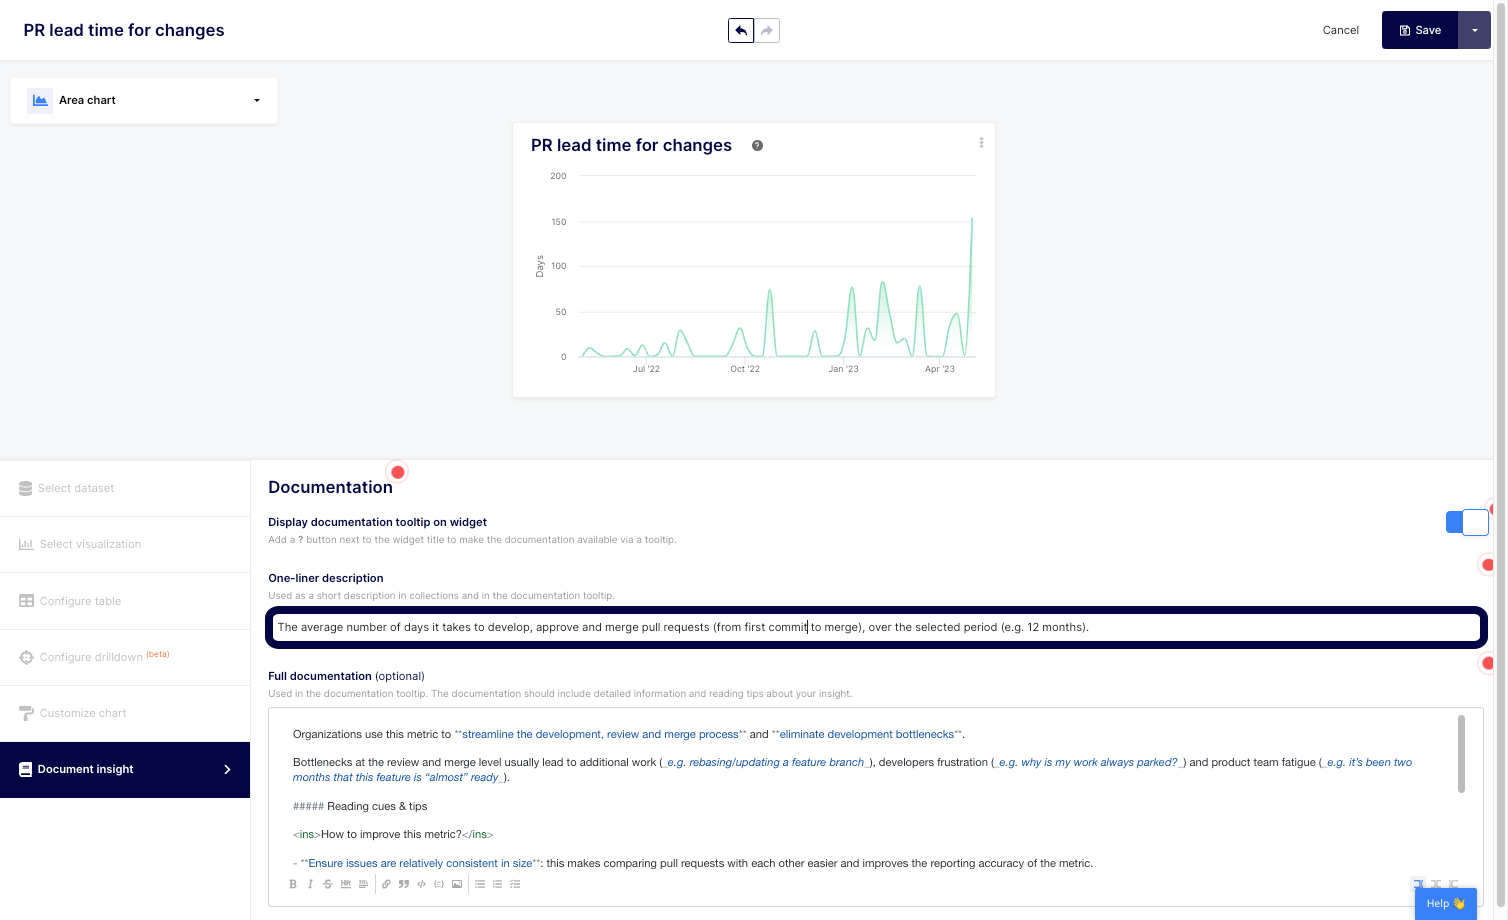
10. Don't forget to "Save" your new metric.
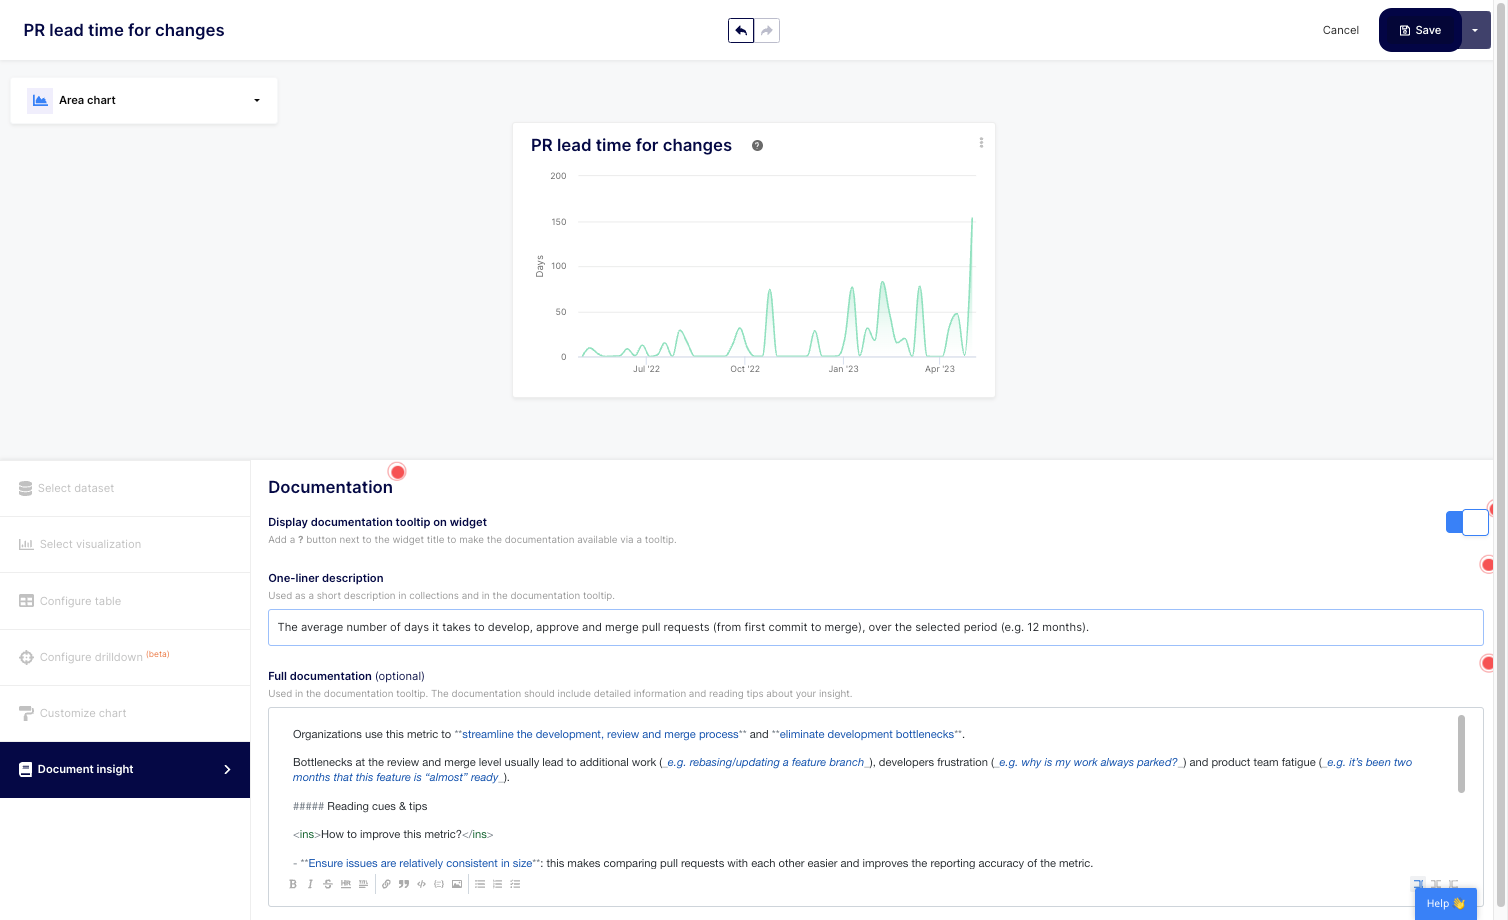
Customizing engineering metrics using custom formulas provides more flexibility and customization, which can lead to more accurate insights and better decision-making. With Keypup's platform, you can easily adjust the formulas and fields used in the calculations, as well as modify the documentation to reflect any changes made.
In conclusion, modifying engineering metrics using custom formulas is a valuable tool for software engineering organizations. By tailoring engineering metrics and reports to fit the unique needs and goals of your organization, you can gain more accurate and meaningful insights, allowing you to make informed decisions and improvements. Give Keypup's platform a try today and see how you can benefit from custom formulas and create custom metrics and reports for your organization.