Why Hooking Up an LLM to Your GitHub and Jira APIs Isn't Enough for True SDLC Analytics
Thinking of building an internal AI tool to analyze your Jira and GitHub data? Discover why DIY SDLC analytics fail, the hidden costs of the Make vs. Buy dilemma, and how Keypup's NLP platform solves the data normalization nightmare.
It’s a thought that crosses the mind of almost every engineering leader today:
"We already have the data in Jira and GitHub. LLMs are incredibly smart now. Why don't we just hook up an AI agent to our APIs and ask it for our DORA metrics?"
In the era of accessible Generative AI, the "Make vs. Buy" pendulum has swung hard toward "Make." Building a quick internal wrapper around OpenAI, Claude, or an open-source model seems like a weekend project. You write a script, pull some JSON payloads, feed them into an AI prompt, and boom—you have an internal engineering dashboard, right?
Wrong.
Extracting raw data is easy. But transforming cross-tool, asynchronous, deeply nested JSON payloads into an accurate, queryable source of truth? That’s a data engineering nightmare.
Here is why relying on a DIY LLM wrapper to analyze your Software Development Lifecycle (SDLC) falls flat, and why Keypup’s purpose-built NLP Analytics platform gives you a depth of integration that an internal tool simply can’t match.
🛠️ The Illusion of the DIY AI Agent (The "Make" Trap)
1. APIs Give You State, Not Context
When you ask an LLM, "What is our average Lead Time for Changes?", the AI needs to know exactly when a developer started coding, when the PR was opened, when it was reviewed, when it was merged, and when the corresponding Jira ticket was moved to "Done."
If you ping the Jira API, it gives you the current state of a ticket. If you ping the GitHub API, it gives you the current state of a commit. To get historical cycle time, your DIY tool has to parse massive webhooks, handle API rate limits, reconstruct timelines from messy event logs, and account for tickets that bounced back and forth between "In Review" and "In Progress" three times. LLMs are terrible at doing this kind of multi-table timeline reconstruction on the fly.
2. The Cross-Tool Normalization Nightmare
Your project managers live in Jira or Azure DevOps. Your developers live in GitHub or GitLab.
A Jira epic contains stories.
A story contains tasks.
A task is linked to three different PRs across two different repositories.
One PR was closed without merging, another was merged with a squash commit.
To an LLM, this is just noise. Without a deeply normalized, relational data layer that natively understands how a GitLab Merge Request relates to a ClickUp task, your DIY AI will hallucinate metrics or give you dangerously inaccurate insights.
3. You’re Building a Maintenance Trap
APIs update. Webhooks drop. Authentication tokens expire. If you build an internal tool, you are dedicating expensive senior engineering hours to maintaining a bespoke BI pipeline instead of shipping core product features.
🚀 The Keypup "Buy" Advantage: Deep Context Meets Natural Language
We built Keypup because we knew that GenAI could revolutionize engineering management—but only if the underlying data layer was flawless.
Keypup is not just an LLM sitting on top of your APIs. It is a sophisticated, pre-built Data Intelligence Layer that automatically ingests, normalizes, and contextualizes your Git and project management data.
When you use Keypup’s Generative AI Assistant, the LLM isn't struggling to parse raw Jira API payloads. It is querying a meticulously structured, highly optimized SDLC database. This allows Keypup to do what DIY tools can't: AI SDLC Diagnosis. We don't just plot charts; we analyze correlations, find bottlenecks, and recommend process improvements in plain English.
💡 See It In Action: Instant Dashboard Prompts
With Keypup, you don't need to write SQL, Python, or manage API limits. You just use natural language.
Here are three concrete examples of prompts you can type directly into the Keypup AI Assistant to instantly generate complete, multi-chart dashboards with actionable narratives.
Prompt 1: The "Cycle Time & Complexity" Dashboard
Instead of: Spending weeks writing complex JOINs to link Jira story points to GitHub PR sizes. Just ask Keypup:
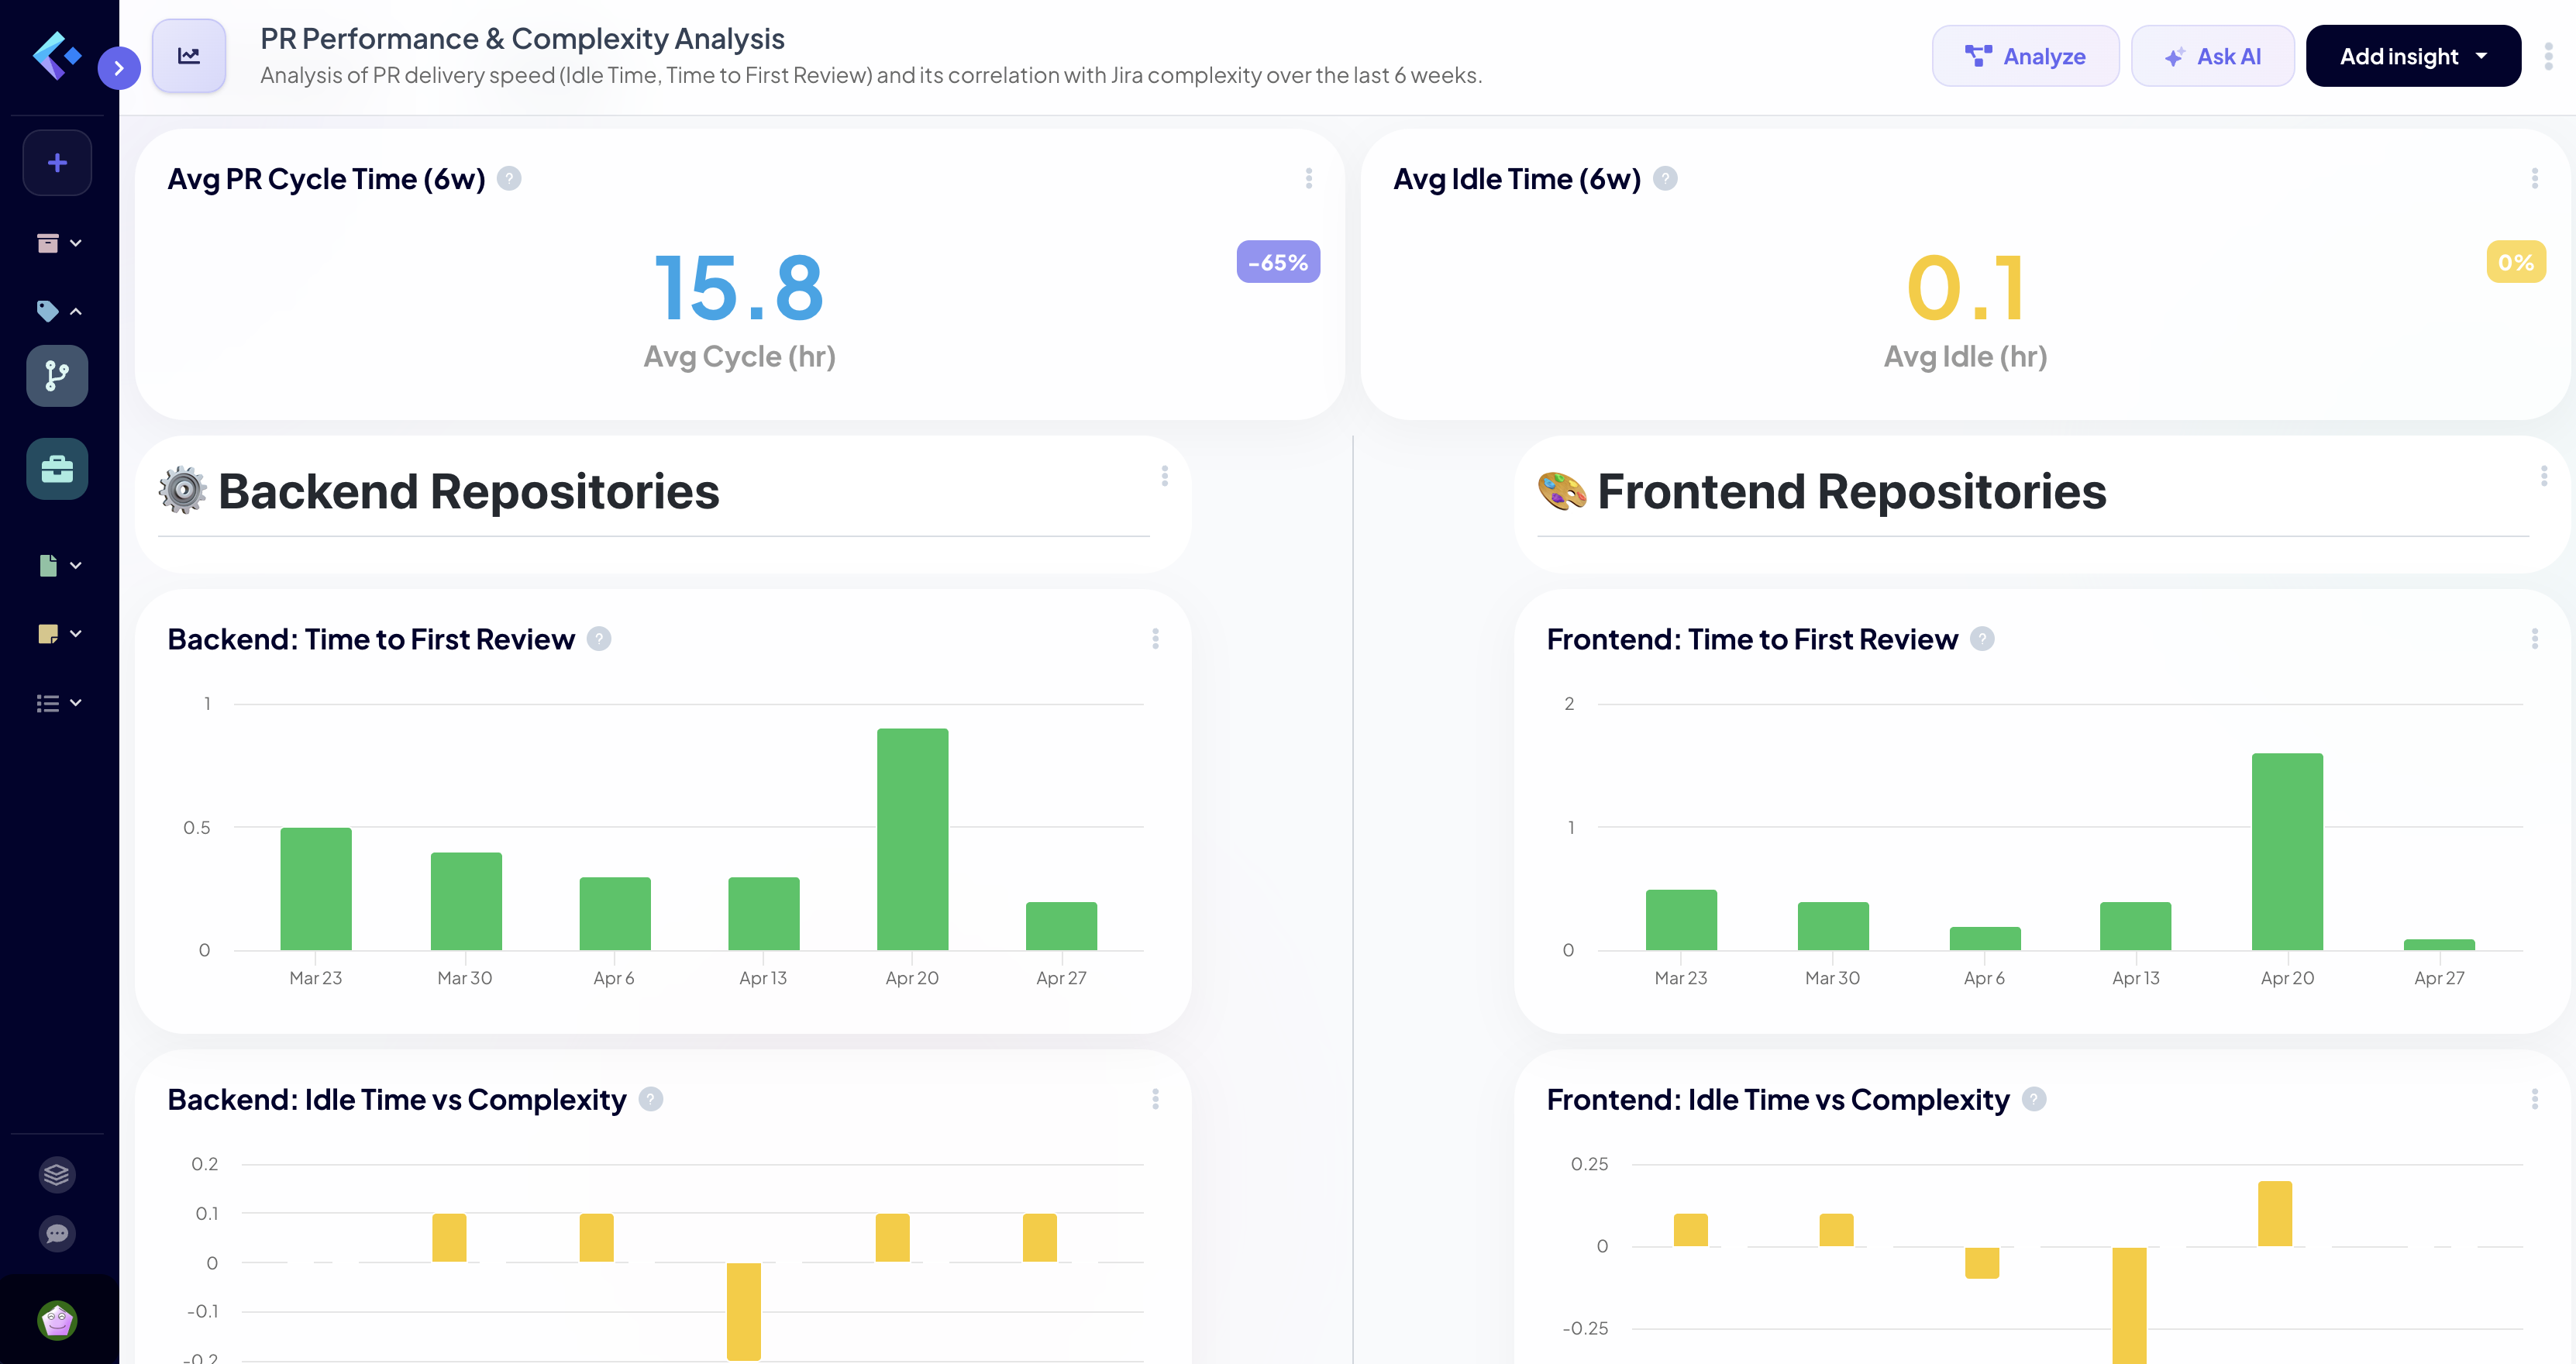
"Create a comprehensive dashboard showing our Pull Request Cycle Time over the last 6 weeks. I want to see how Idle Time and Time to First Review correlate with the Jira issue complexity (story points). Break it down by backend and frontend repositories."
The Result
Keypup instantly maps the repositories, pulls the historical state changes, builds the charts, and highlights exactly where large story points are causing code review bottlenecks.
Prompt 2: The "DORA & Quality" Dashboard
Instead of: Trying to manually calculate Change Failure Rate by comparing bug ticket creation dates to deployment tags. Just ask Keypup:
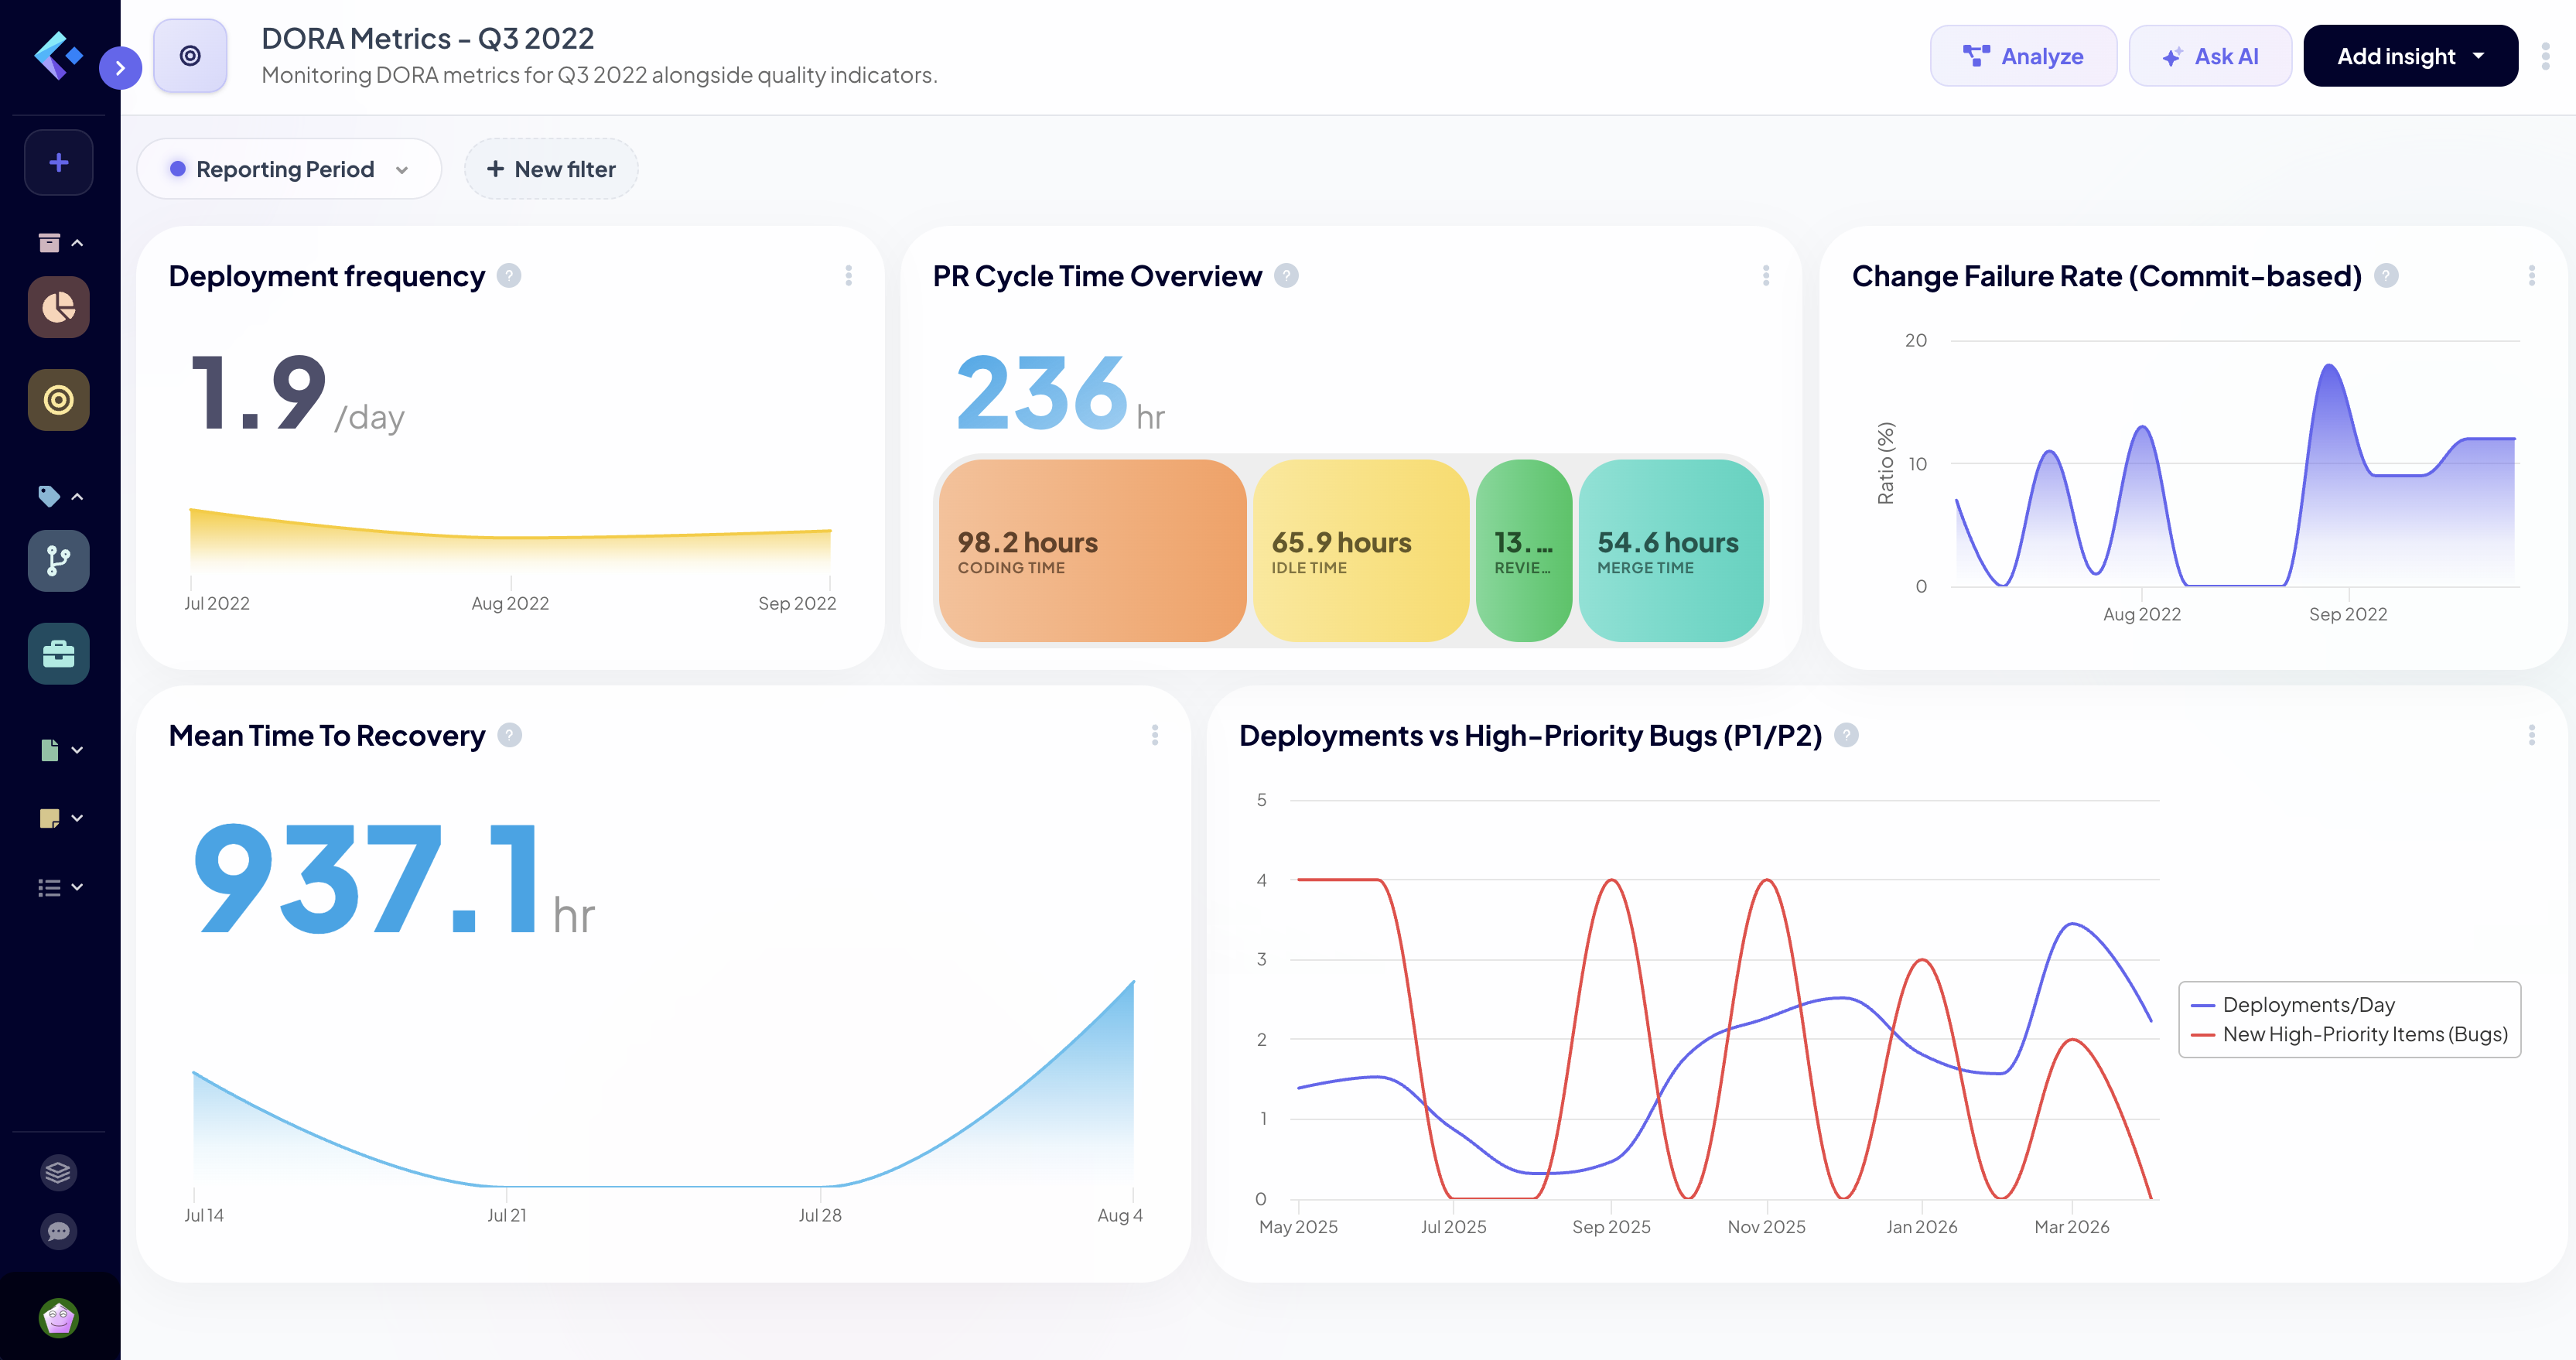
"Build a DORA metrics dashboard for Q2. Also, create a widget that overlays our Deployment Frequency with the number of new P1/P2 bugs reported in Jira during the same timeframe. Are we shipping faster but breaking more things?"
The Result
Keypup provides the standard DORA metrics (Deployment Frequency, Lead Time, MTTR, Change Failure Rate) and uses the AI SDLC Diagnosis tool to explicitly answer your question in text format, warning you if velocity is negatively impacting quality.
Prompt 3: The "Sprint Retrospective & Bottleneck" Dashboard
Instead of: Wasting 2 hours before your sprint retro compiling spreadsheets to see who is overloaded. Just ask Keypup:
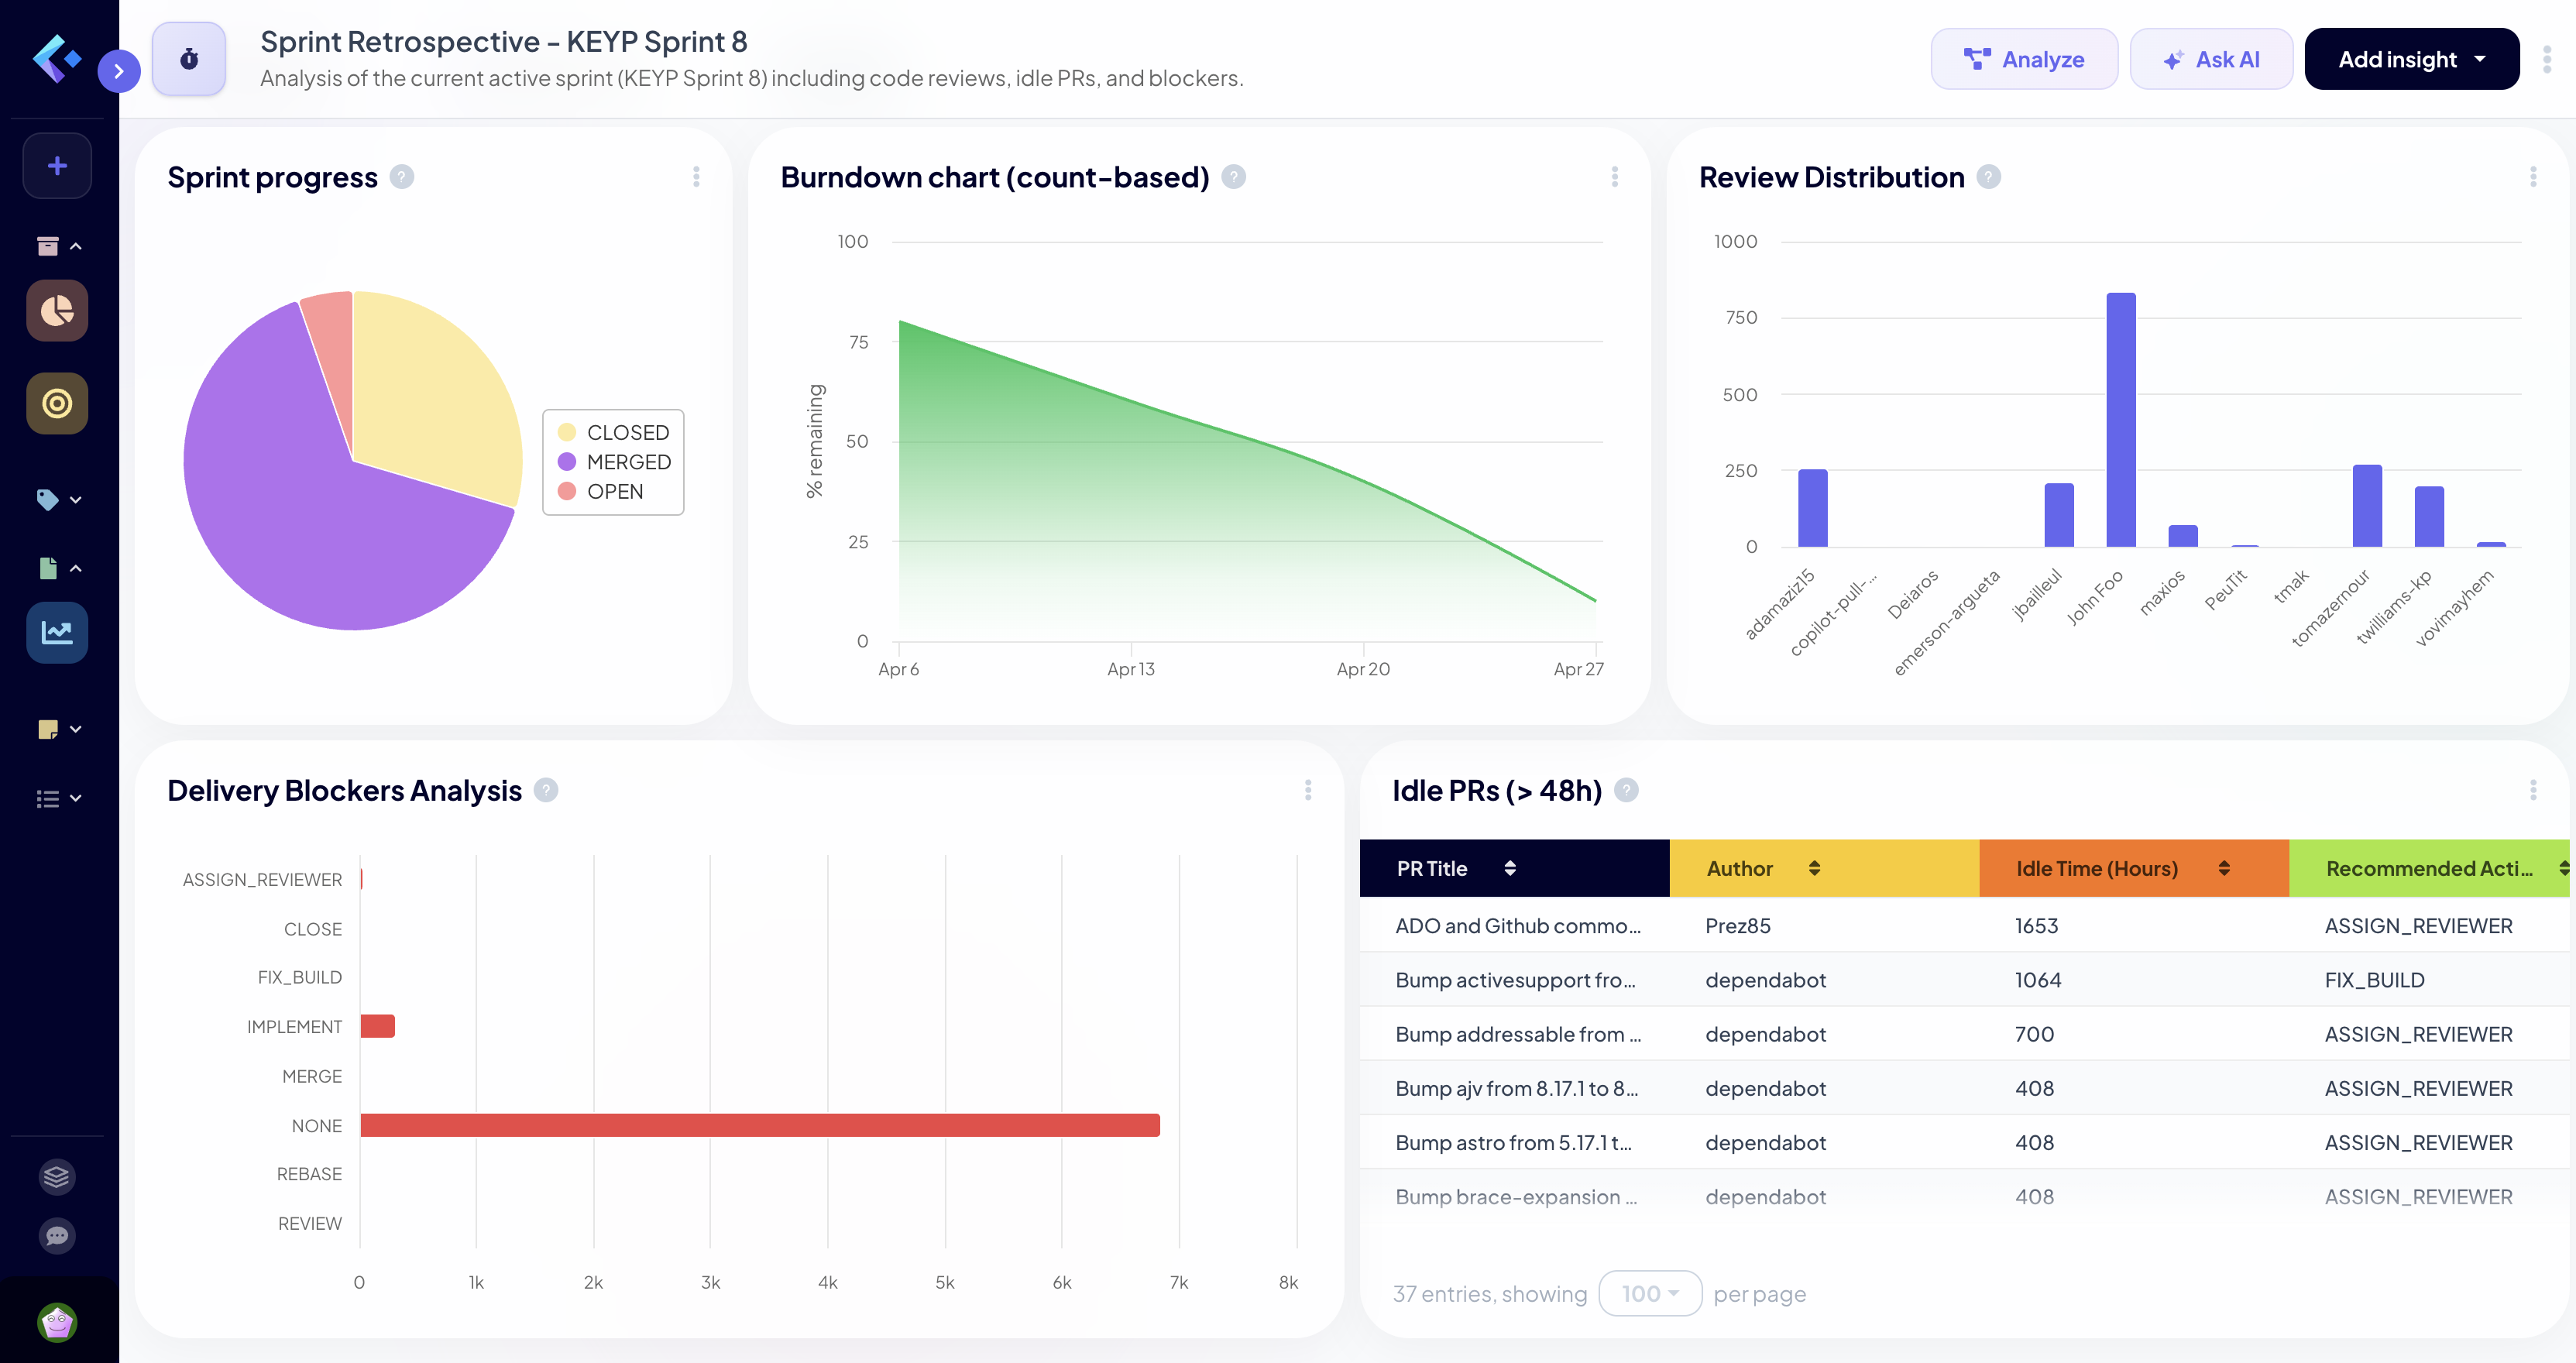
"Generate a Sprint Retrospective dashboard for the current active Jira sprint. Show me the distribution of code review requests across the team, highlight any PRs that have been idle for more than 48 hours, and summarize our biggest delivery blocker this week."
The Result
An instant, objective view of workload distribution that fosters a blameless, data-driven conversation about how to unblock the team right now.
🛑 Stop Building Dashboards. Start Improving Velocity.
The Make vs. Buy decision for Engineering Analytics is simple in 2026. You can build an internal tool to pull raw data. But you cannot build a system that deeply understands the nuances of the software development lifecycle, contextualizes data across isolated platforms, and provides NLP-driven recommendations without spending hundreds of thousands of dollars in engineering time.
Your team’s job is to build your core product. Keypup’s job is to tell you exactly how efficiently you are building it.
Why do some Jira tickets bounce between engineers and teams for weeks before anyone fixes them? Learn what engineering leaders on Reddit say about ticket reassignment churn at enterprise scale, and how Keypup MCP uses previous assignees, assignment dates, issue types, projects and linked pull request authors to measure how often tickets change hands, what each hand-off costs in cycle time, who actually wrote the code and which open tickets are being passed around right now.
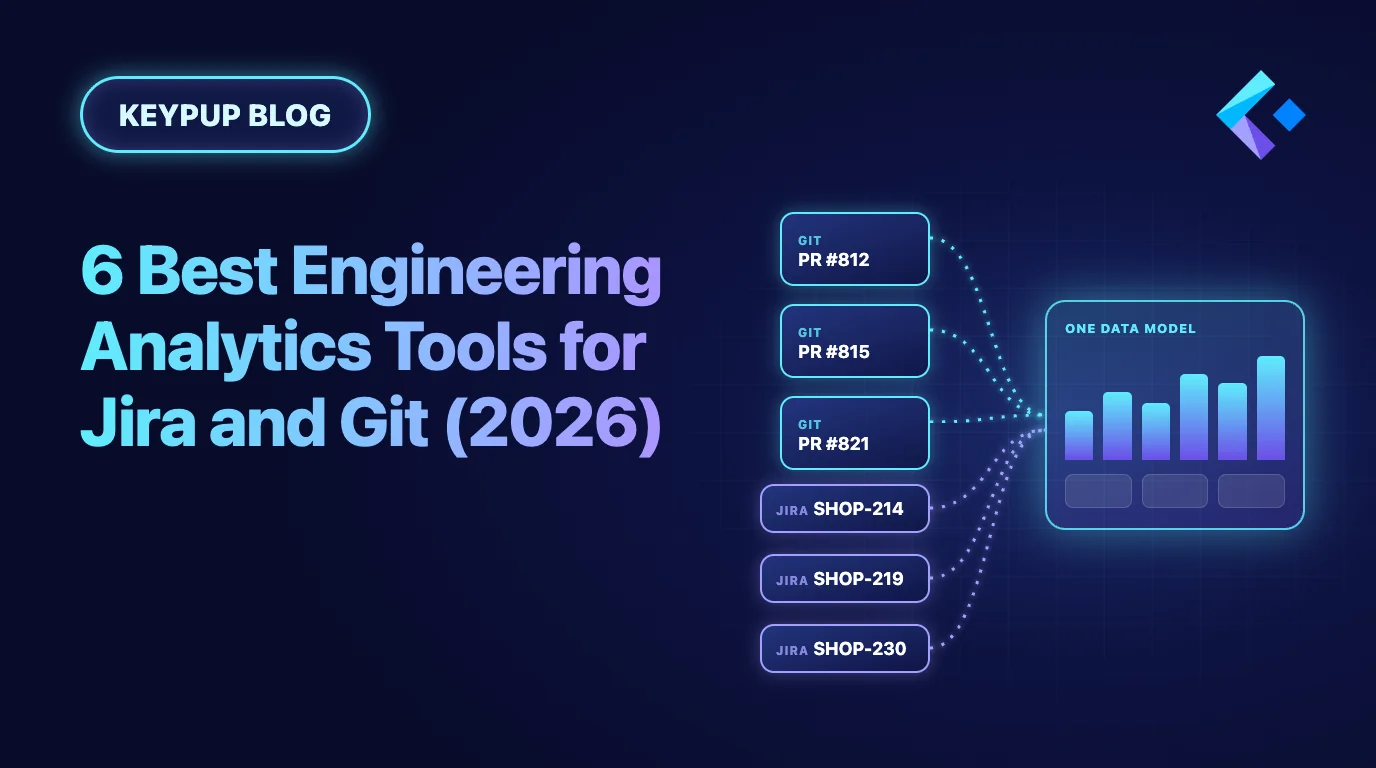
Compare the 6 best engineering analytics tools for Jira and Git in 2026 — Keypup, LinearB, Jellyfish, Swarmia, Faros AI and Pluralsight Flow — across Git and Jira unification, DORA Metrics and cycle time, dashboard customization, AI and natural language, integration breadth, setup speed and security. Find out which platform turns your code and ticketing data into one reporting layer with prescriptive recommendations.
Why do pull requests sit for days before anyone reviews them? Learn what engineering leaders on Reddit say about code review bottlenecks at enterprise scale, and how Keypup MCP uses review request dates, first review dates, approvals, reviewers and lines changed to measure your wait for first review, break cycle time into phases, find when requests get stuck, show who carries the review load and list the pull requests waiting right now.