Measuring Development Metrics Without the Micromanagement Trap: How AI Changes the Conversation
Developers hate engineering metrics because they feel like surveillance. Learn how to use Keypup's AI to shift the focus from individual micromanagement to systemic SDLC improvement.
If you want to start a heated argument in any developer community, just bring up "Engineering Productivity Metrics."
Across platforms like Reddit, Hacker News, and industry blogs, the sentiment is overwhelmingly skeptical. Developers frequently complain that frameworks meant to measure team health—like DORA metrics—are quickly weaponized by management into tools for individual surveillance.
At Keypup, we believe the solution isn't to stop measuring. The solution is to use Generative AI to instantly supply the missing context, shifting the conversation from "Who is failing?" to "Where is the system broken?"
🛑 The Three Traps of Traditional Analytics
When companies use standard BI dashboards to track Git and Jira data, they usually fall into one of three traps. Industry experts have been sounding the alarm on this for years:
1. The "Gaming the System" Trap
If leadership decrees that "PRs Merged per Week" is the new KPI for success, developers will naturally protect themselves. As a recent Dev.to guide on productivity highlighted: "When you measure PR count, engineers split work into tiny, meaningless chunks. You get the behavior you measure, and most teams are measuring activity instead of outcomes." Output looks incredible on the dashboard, but code review becomes a fragmented nightmare.
2. The Individual Surveillance Trap
When metrics are used to stack-rank developers, psychological safety evaporates. An article by Pensero perfectly captured this: "Individual-level metrics—commits per engineer, PRs merged per week... are consistently unreliable as productivity indicators. They are easy to measure and easy to game. The metrics that matter operate at the team and system level." DevDynamics echoes this, warning: "It's not uncommon for teams to feel like these metrics are just another way for management to micromanage them."
3. The Missing Context Trap
A dashboard shows that Lead Time for Changes has spiked. Without context, managers often blame the developer with the lowest throughput. We saw this years ago when engineering teams at companies like Uber pushed back against measuring pure "Diff count" (code changes) without considering the massive contextual difference between doing a complex, legacy code migration versus shipping a simple UI bug fix.
🤖 Shifting the Conversation: Real Developer Pain Points Solved by AI
Keypup’s NLP Analytics platform was designed to analyze the system, not surveil the individual.
Because Keypup deeply integrates Jira ticket metadata with GitHub PR activity, our AI Agent understands the nature of the work. Let’s look at three real-world complaints sourced from developer communities on Reddit, and how Keypup’s AI flips the script from micromanagement to true SDLC diagnosis.
Scenario 1: The Weaponization of Team Metrics
The Developer Complaint:
Reddit (r/ExperiencedDevs)
"My company just rolled out a new dashboard tracking DORA metrics. Two sprints later, my manager is pulling me into a 1-on-1 asking why my specific 'Lead Time for Changes' was slower than the team average last week. I was mentoring a junior dev and fixing a massive legacy database migration! It feels like they took a framework meant for systemic team health and turned it into a weapon to punish individuals."
The Keypup Prompt:"Analyze 'Lead Time for Changes' for the team this week. Cross-reference individual PR cycle times with Jira Issue Type (e.g., Tech Debt, Mentorship tasks, Features) and highlight why any outliers exist."
Analysis from Keypup AI
🔑 Key Insights
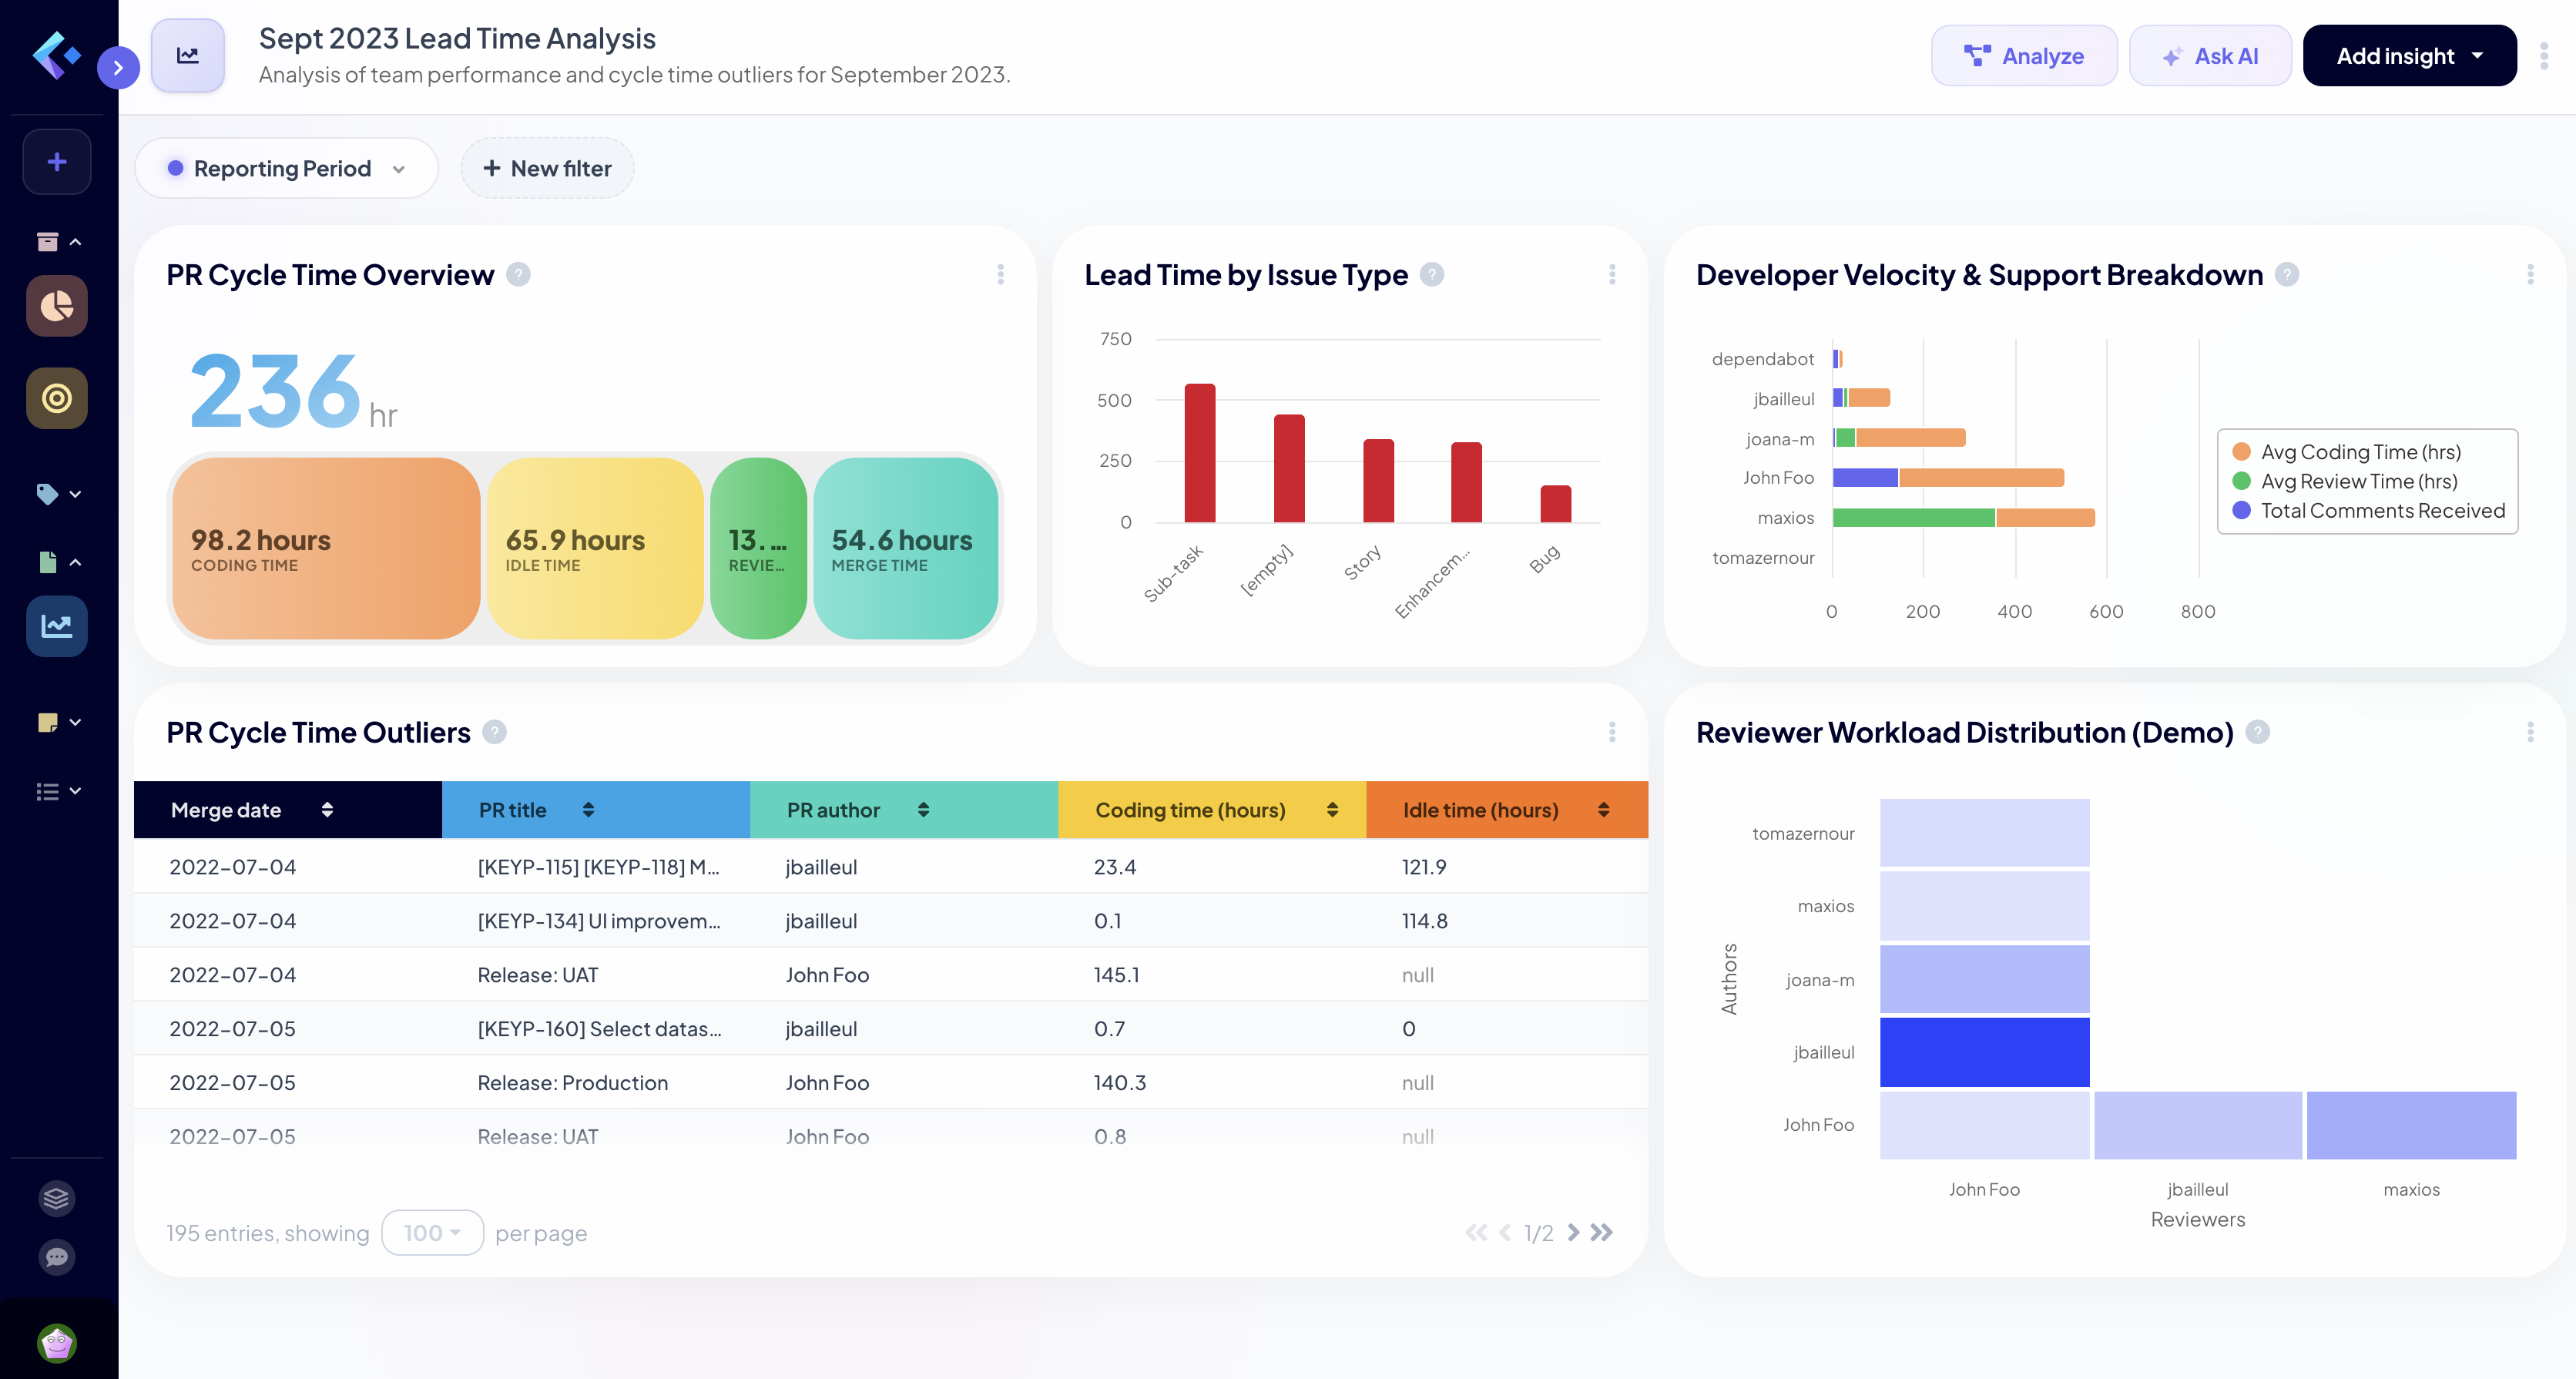
Healthy Baseline Performance: The average cycle time across the team is 98.2 hours, with the merge phase being the most efficient at 13.8 hours.
High Complexity in Sub-tasks: Interestingly, "Sub-tasks" have the highest lead time at 570 hours, followed by general untagged issues (442 hours). This suggests that granular tasks are either being used for complex work or are getting lower priority in the review queue.
Strong Individual Ownership: John Foo demonstrates significant output with 145 total comments received and a very low average review time of 0.9 hours, indicating rapid iterations once reviews start.
⚠️ Bottlenecks and Problem Areas
Review Wait Times (Idle Time): The "PR Cycle Time Overview" shows an average 65.9 hours of idle time. This is the single largest bottleneck, representing nearly 67% of the total cycle time spent waiting for a review to start.
Extreme Outliers: Several PRs (e.g., Release: Production in hq/pull/356) show cycle times exceeding 1,000 hours. Many of these are large release PRs authored by John Foo, which likely accumulate changes over long periods before final merging.
Review Distribution Silo: The workload distribution heatmap shows that jbailleul is the primary reviewer for John Foo (25 PRs), while the reciprocal load is much lower (5 PRs). This indicates a potential "single point of failure" in the review chain for the team's most active author.
💡 Recommendations
Address Idle Time: Implement a team agreement to start reviews within 24 hours of a request. The data shows that once a review starts, it typically completes quickly; the delay is purely in the "start" phase.
Deconstruct Sub-tasks: Investigate why "Sub-tasks" take longer than "Stories" (341 hrs) or "Bugs" (150 hrs). If sub-tasks are meant to be smaller units of work, their lead time should be significantly lower.
Diversify Reviewers: Encourage Tina Rey or Silvia Lang to pick up more reviews for John Foo to reduce the dependency on jbailleul and improve knowledge sharing across projects like DoeProj.
Automate Release PRs: Large release outliers suggest a manual "bottlenecking" release process. Moving toward more frequent, automated deployments would eliminate these 1,000+ hour cycle time spikes.
🚀 Priority Actions
Reduce Idle Time: Set a Slack/Teams alert for PRs that have been in "Requested" state for more than 24 hours.
Review Sub-task Workflow: Audit the top 5 longest-running sub-tasks to see if they were blocked by dependencies or simply ignored.
Balance Review Load: Reassign at least 20% of jbailleul’s incoming review requests to other senior team members to prevent burnout risk-mitigate the delivery-focused.
The Conclusion: Instead of a punishing 1-on-1, the manager uses this data to recognize the developer's high-impact team support and involvement in the overall team's success. The AI provides the context that raw numbers erase.
Scenario 2: The "Gaming the System" Dilemma
The Developer Complaint:
Reddit (r/devops)
"Our CTO decided that to 'increase velocity,' they are going to track 'Pull Requests merged per week' per developer. The result? Developers are now splitting what should be one cohesive feature into 10 tiny, fragmented PRs just to pad their stats. Reviewing code has become an absolute nightmare because there's no context."
The Keypup Prompt:"Generate a report comparing our PR Merge Volume against Jira 'Story Points'. Identify if PR volume is inflating without a corresponding increase in actual resolved story points or feature delivery."
Analysis from Keypup AI
🔑 Key Insights
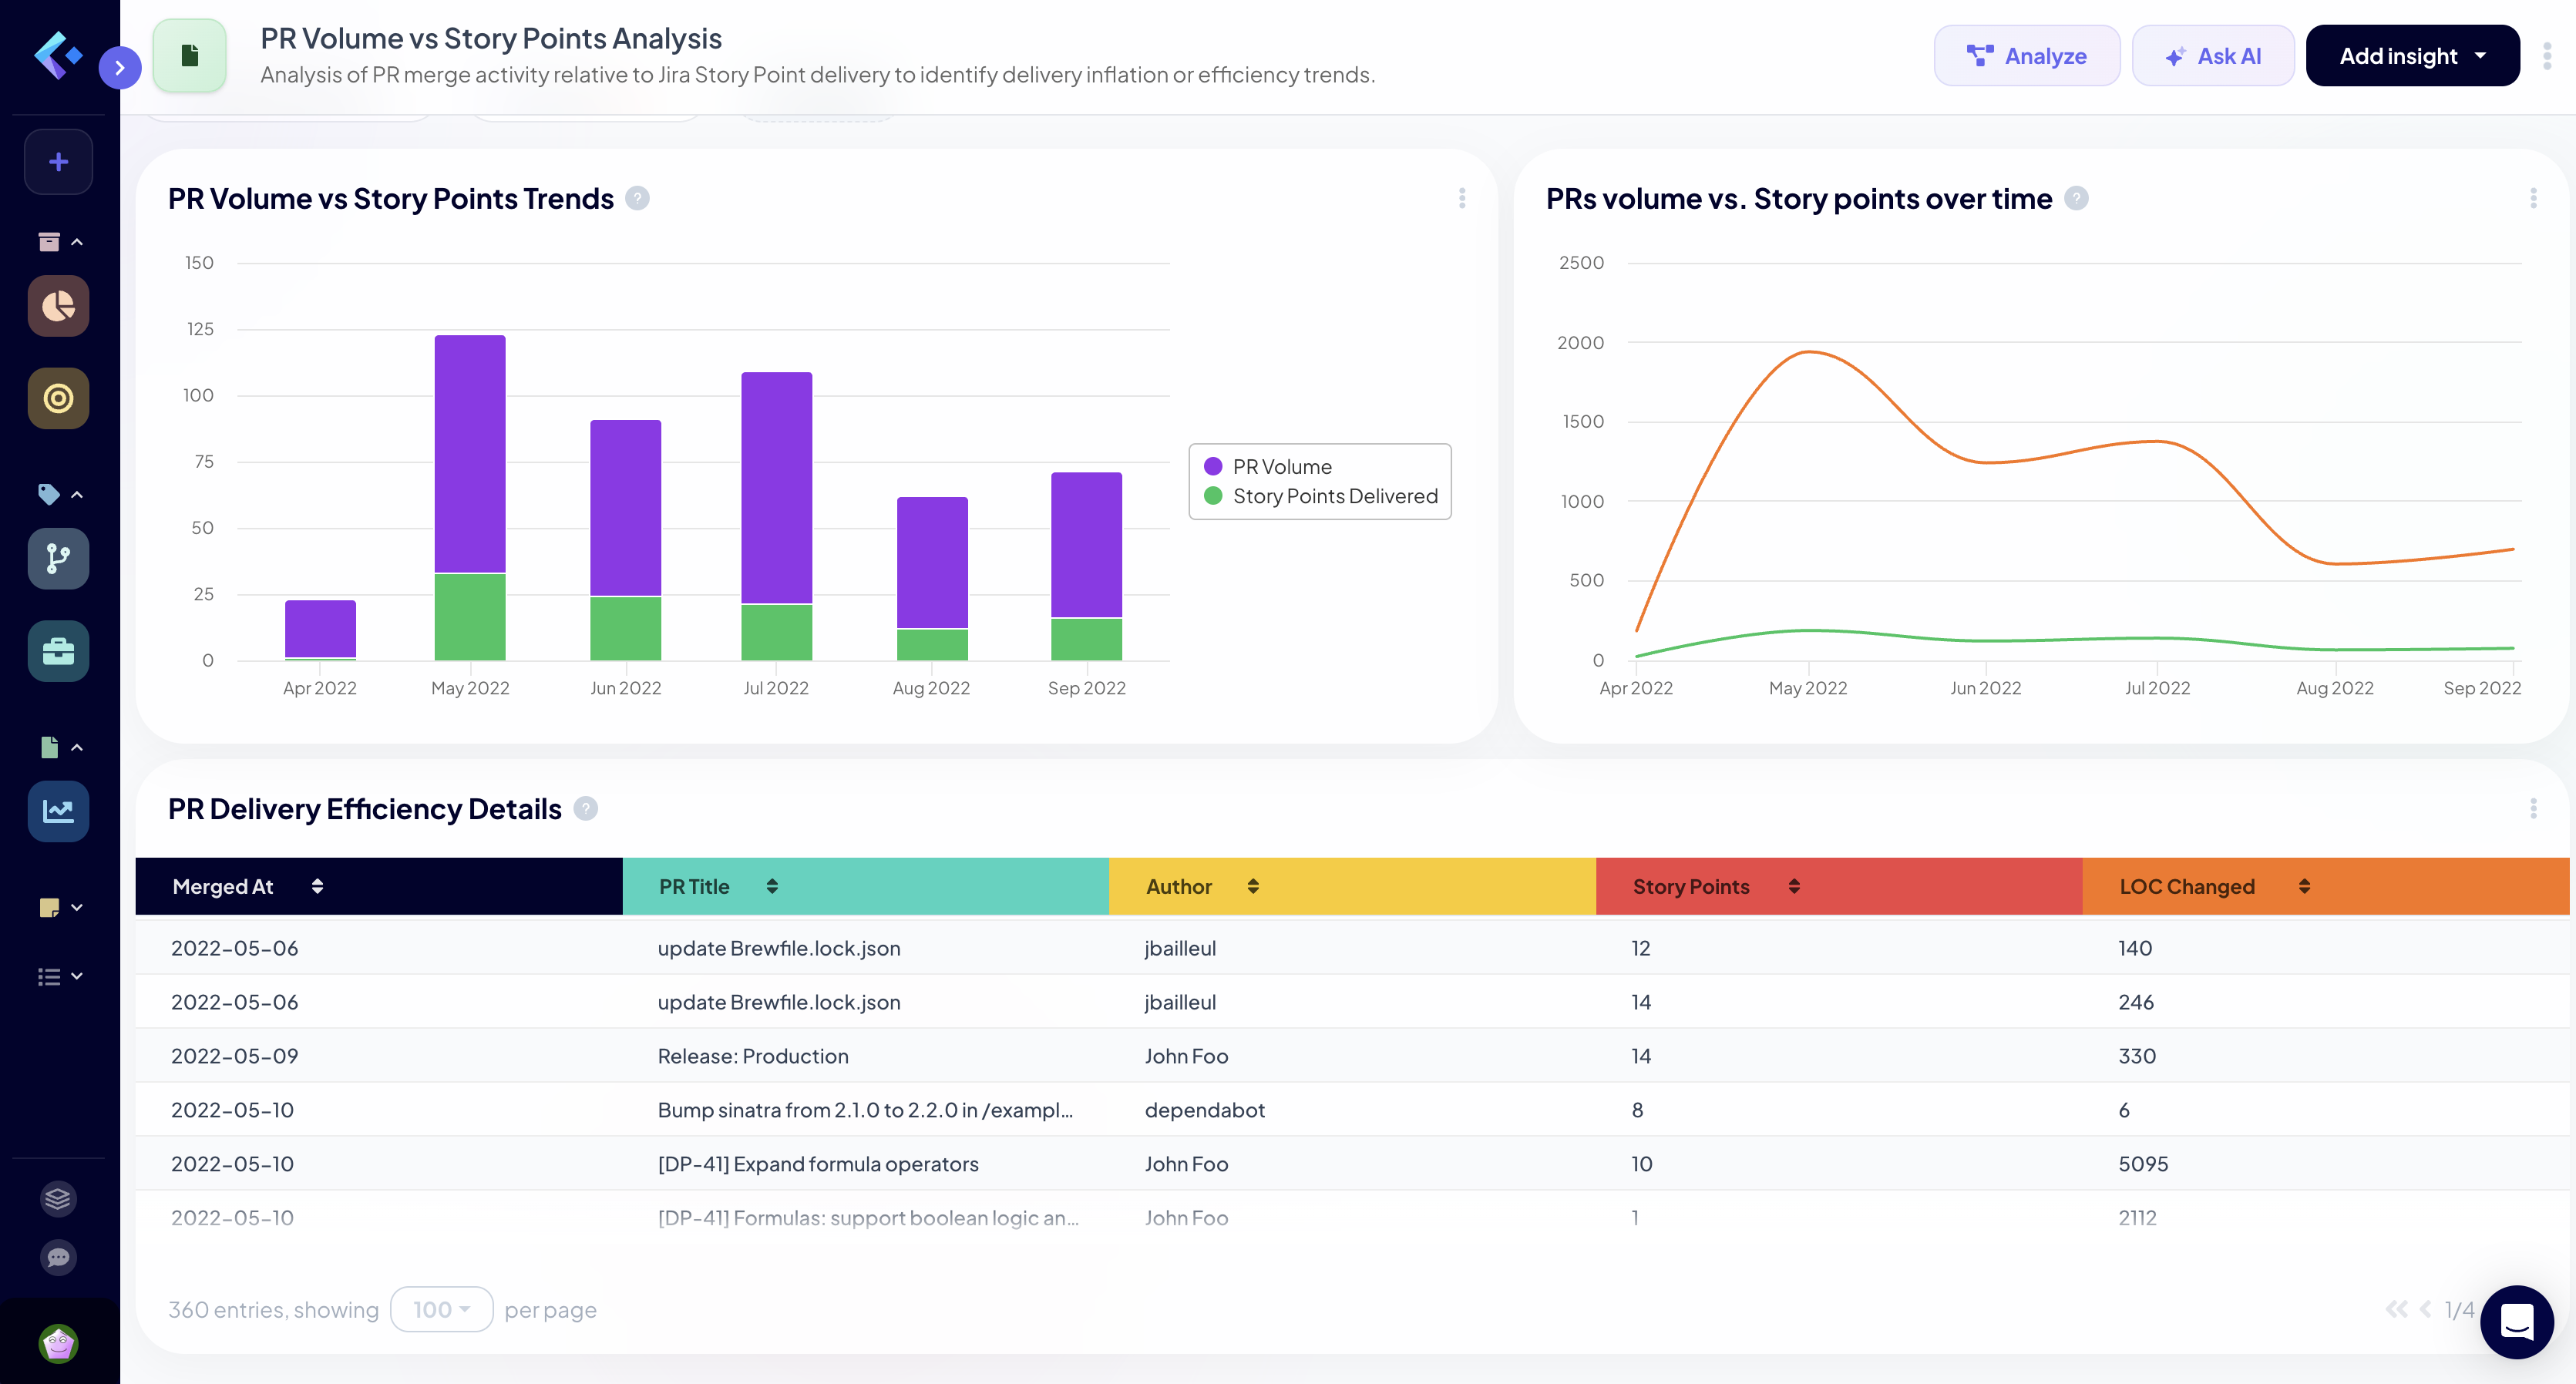
Strong Activity vs. Stable Delivery: While PR merge volume peaked in May 2022 (90 PRs), the Story Points delivered remained relatively stable throughout the period, with a slight downward trend in efficiency starting in June.
Story Point Decoupling: The chart "PR Volume vs Story Points Trends" reveals that in July, the team merged 88 PRs (nearly a peak) but only delivered 21 Story Points. In contrast, June saw 67 PRs deliver 24 Story Points. This suggests that the "value per PR" is fluctuating, likely due to a surge in smaller maintenance tasks or refactoring during the summer months.
Review Proxy Trends: Review activity (as measured by reviewer assignments) closely tracks the volume of code changes. Both peaked in May and July, indicating the team's review capacity is generally scaling with production, though the "Reviews Performed" metric remains significantly lower than "Lines Changed," which is expected for large PRs.
⚠️ Bottlenecks and Problem Areas
Refactoring & Maintenance Overload: Looking at the "PR Delivery Efficiency Details," many PRs (e.g., "Remove onboarding variants" and "White background on settings page") are associated with very low Story Point values despite significant lines changed. This points to a high volume of technical debt or UI polishing that isn't being captured in standard feature estimation.
Delivery Inflation in May: May 2022 stands out as the highest volume month for both PRs (90) and Story Points (33). However, the drop-off in subsequent months suggests a potential "burnout" or a shift from feature development to stability/patching, where PR volume stays moderate but point delivery drops by ~50% (to 16 in September).
The Conclusion: The AI immediately detects an anomaly and thanks to the context, it appears a metric is being gamed. Leadership can realize this factually and focus from vanity outputs (PR counts) back to actual value delivery (resolved Jira stories).
Scenario 3: The Lack of Context in 'Idle Time'
The Developer Complaint:
Reddit (r/softwareengineering)
"I'm so sick of productivity dashboards. Our new tool flagged me because my PRs have a high 'Time to First Review' and 'Idle Time.' What the dashboard doesn't show is that I work on a highly specialized microservice, and the only two senior devs who have the authority to approve my PRs are constantly stuck in architecture meetings. I'm literally begging people in Slack to review my code."
The Keypup Prompt:"Create a dashboard of all PRs currently in the 'Idle' state. Correlate this with the assigned reviewers' current Jira workload to see if our code-owners are over-allocated."
Analysis from Keypup AI
🔑 Key Insights
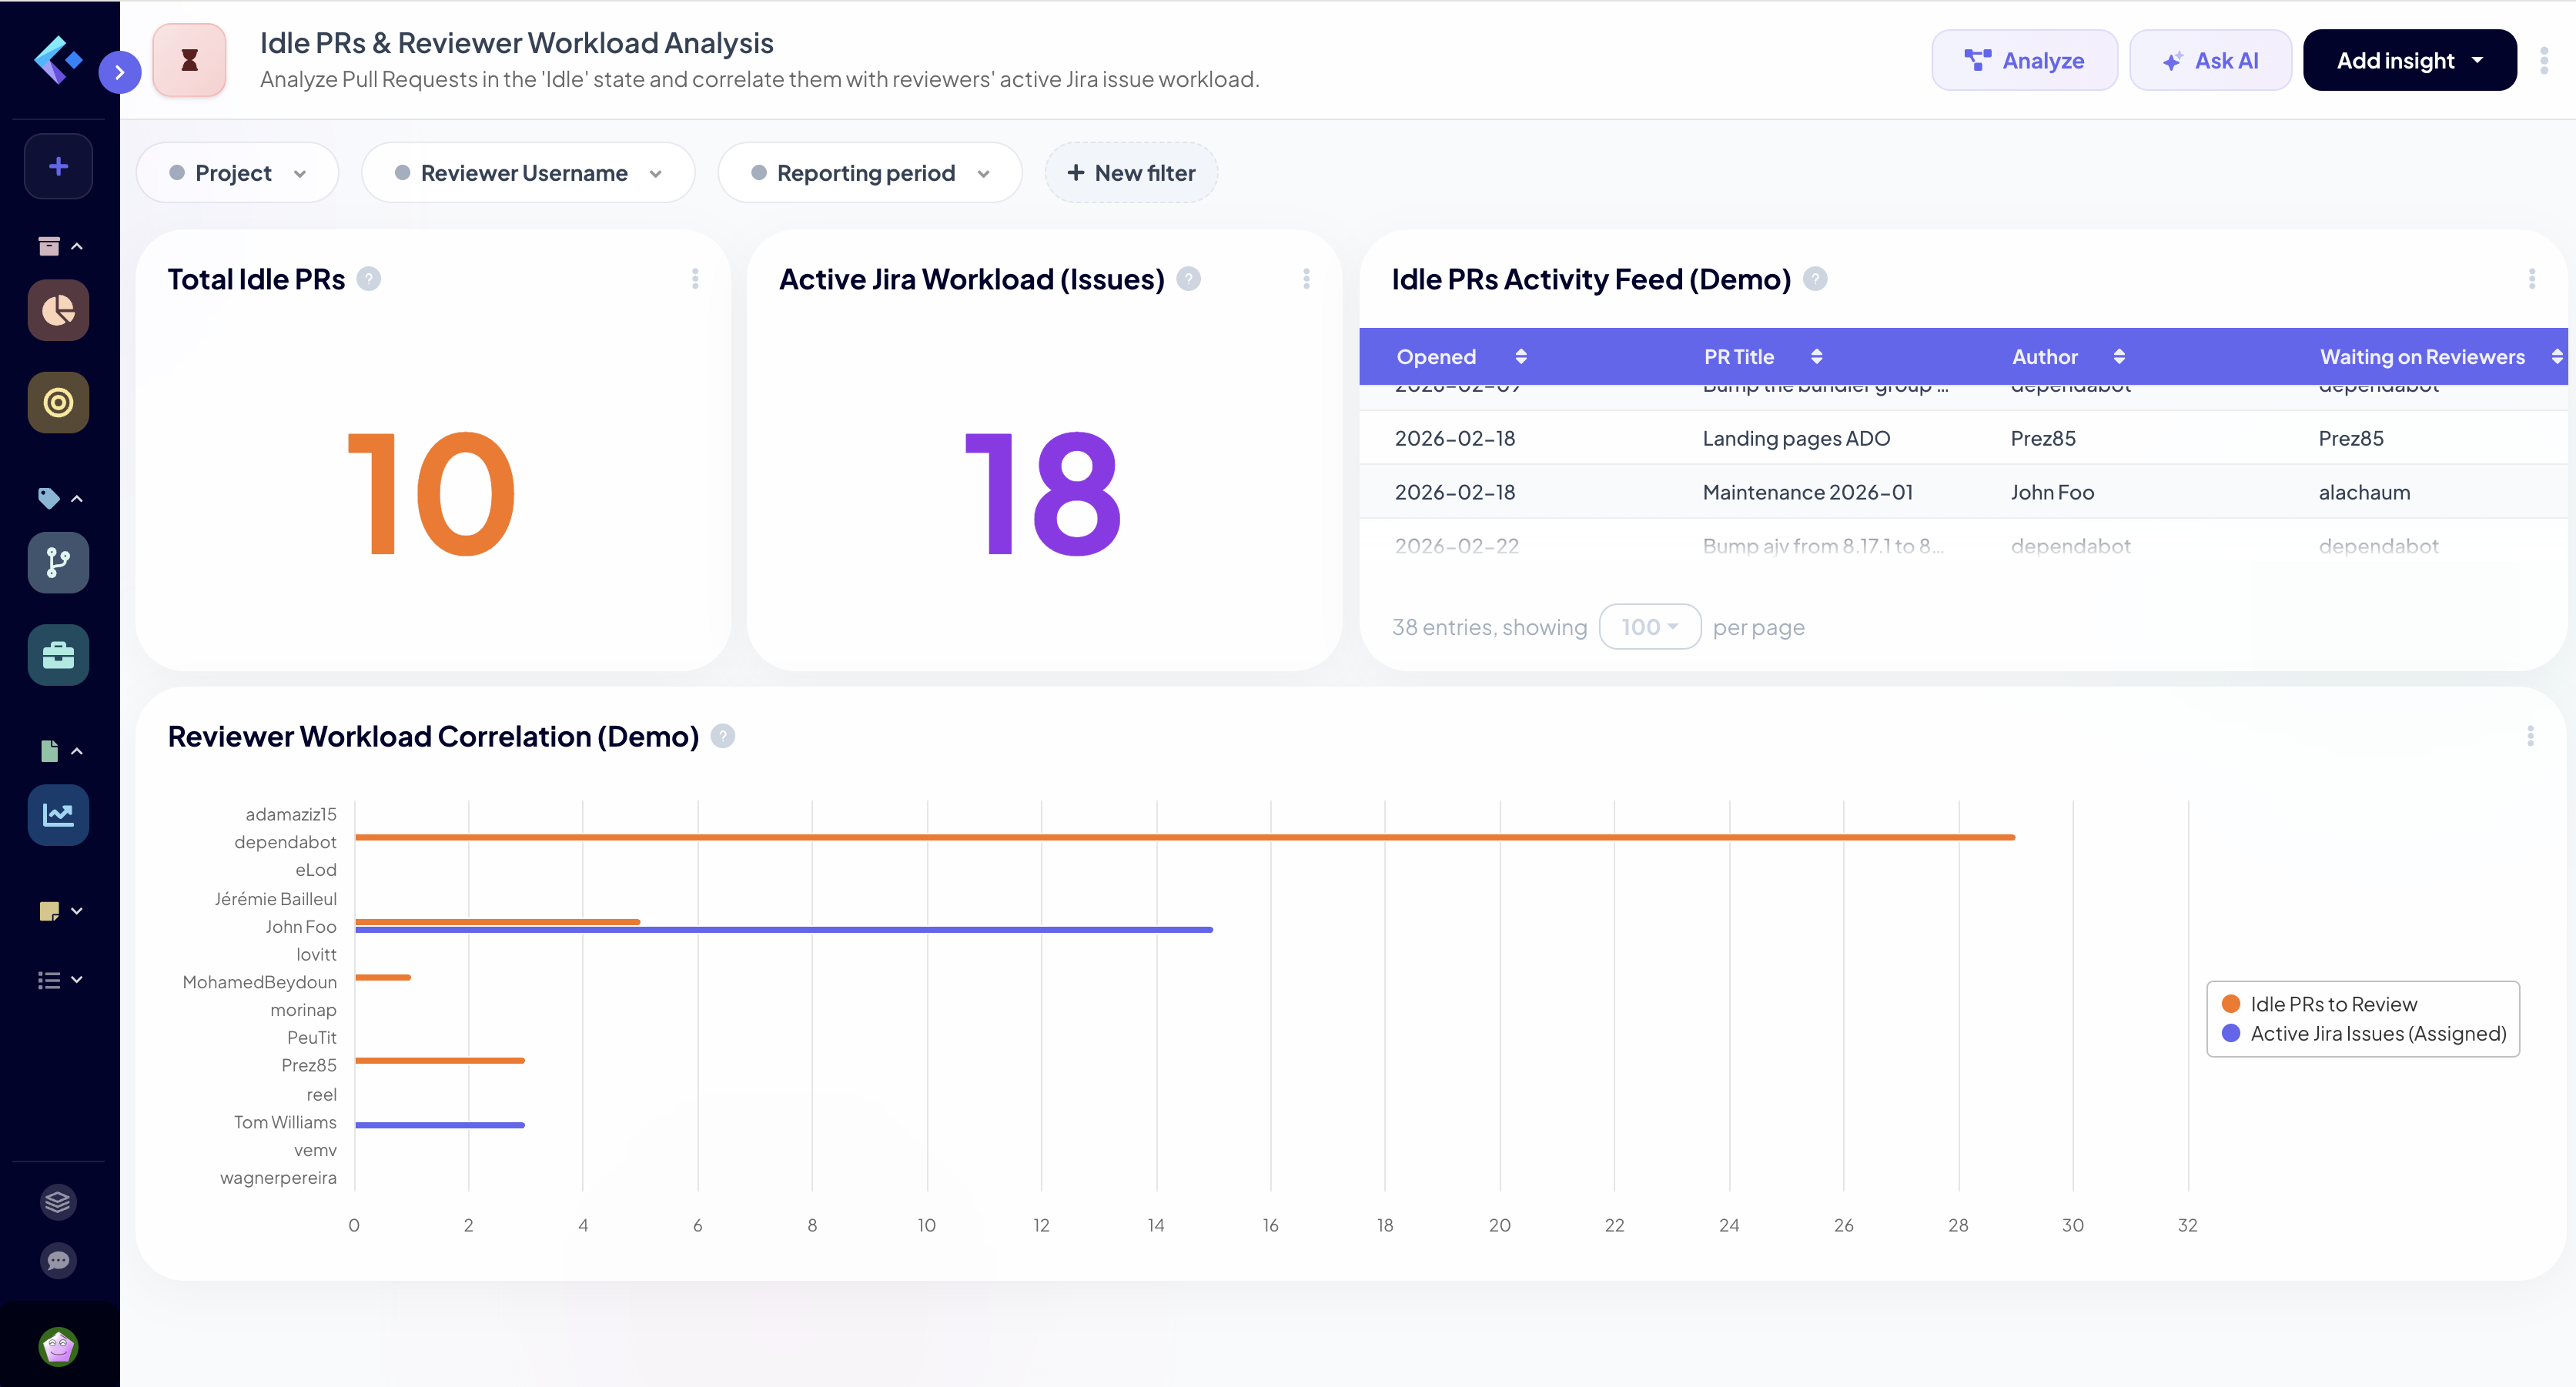
Significant Reviewer Overload: There is a clear correlation between high Jira workloads and idle PRs. Specifically, John Foo (demo alias) is currently assigned to 15 active Jira issues while also having 5 idle PRs waiting for review. This suggests a systemic bottleneck where primary reviewers are prioritized for development tasks over review activities.
Long-standing Idle PRs: The "Idle PRs Activity Feed" reveals pull requests that have been open for an exceptionally long time, with one PR ("Compact operators into one list…") sitting idle for 151 days.
Backlog Imbalance: The dashboard shows a total of 10 idle PRs against 18 active Jira issues in the "To Do" state. The high ratio of idle PRs relative to active development tasks indicates that the team's "outflow" (merging/closing) is not keeping pace with its "inflow."
💡 Recommendations
Review-First Culture: Implement a "Review First" policy where team members are encouraged to clear their pending review queue before picking up new Jira issues from the "To Do" column.
Redistribute Workload: Reassign some of the 15 active Jira issues currently assigned to John Foo to other team members who currently have zero active issues (e.g., Tom Williams or Silvia Lang) to free up time for code reviews.
Automate Dependency Management: Consider implementing a tool or workflow to auto-merge or batch "green" Dependabot PRs to reduce backlog clutter.
Stale PR Cleanup: Conduct a backlog grooming session specifically for PRs idle for more than 30 days. Items like the 151-day-old PR should either be closed as "won't do" or aggressively prioritized if still relevant.
🚀 Priority Actions
Rebalance Assignments: Move at least 5 Jira issues from John Foo to available team members.
Immediate Review Session: Schedule a 1-hour block for the team to focus exclusively on the 10 idle PRs identified.
Dependabot Audit: Review the 29 idle Dependabot PRs and either merge or close them to clear the visualization noise.
Update WIP Limits: Set a maximum limit for "Active Jira Issues" assigned to any single developer who also has pending reviews.
The Conclusion: The AI proves that the bottleneck is a process failure (review workload imbalance), not a developer failure. The manager fixes the system, and the developer feels advocated for, rather than surveilled.
📈 Context is the Cure for Micromanagement
Engineering metrics are only toxic when they are weaponized. When used correctly, they are the ultimate tool for developer advocacy. They prove when teams are overworked, they highlight when technical debt is slowing down feature delivery, and they justify the need for more headcount.
Keypup’s AI Assistant removes the friction of data gathering and injects the nuance that traditional dashboards lack. By allowing anyone to ask plain-English questions about the SDLC, Keypup ensures that the whole team has a shared, contextualized understanding of how work actually gets done.
CI/CD pipelines fail for dozens of reasons unrelated to code quality—network timeouts, resource exhaustion, flaky tests. Yet analytics tools treat every red build as a defect. Discover how to filter infrastructure noise and measure true engineering performance.
Squash merges, interactive rebases, and monorepos systematically corrupt SDLC analytics. Discover how modern Git workflows distort metrics by up to 95%—and how to get accurate insights anyway.
SDLC analytics tools excel at showing problems but fail at solving them. Learn how conversational AI analytics transforms "red dashboards" into actionable workflows that actually improve engineering performance.