We're thrilled to unveil the brand-new Team Benchmark dashboard, a significant addition to our analytics suite designed to offer unprecedented insight into your team's development dynamics!
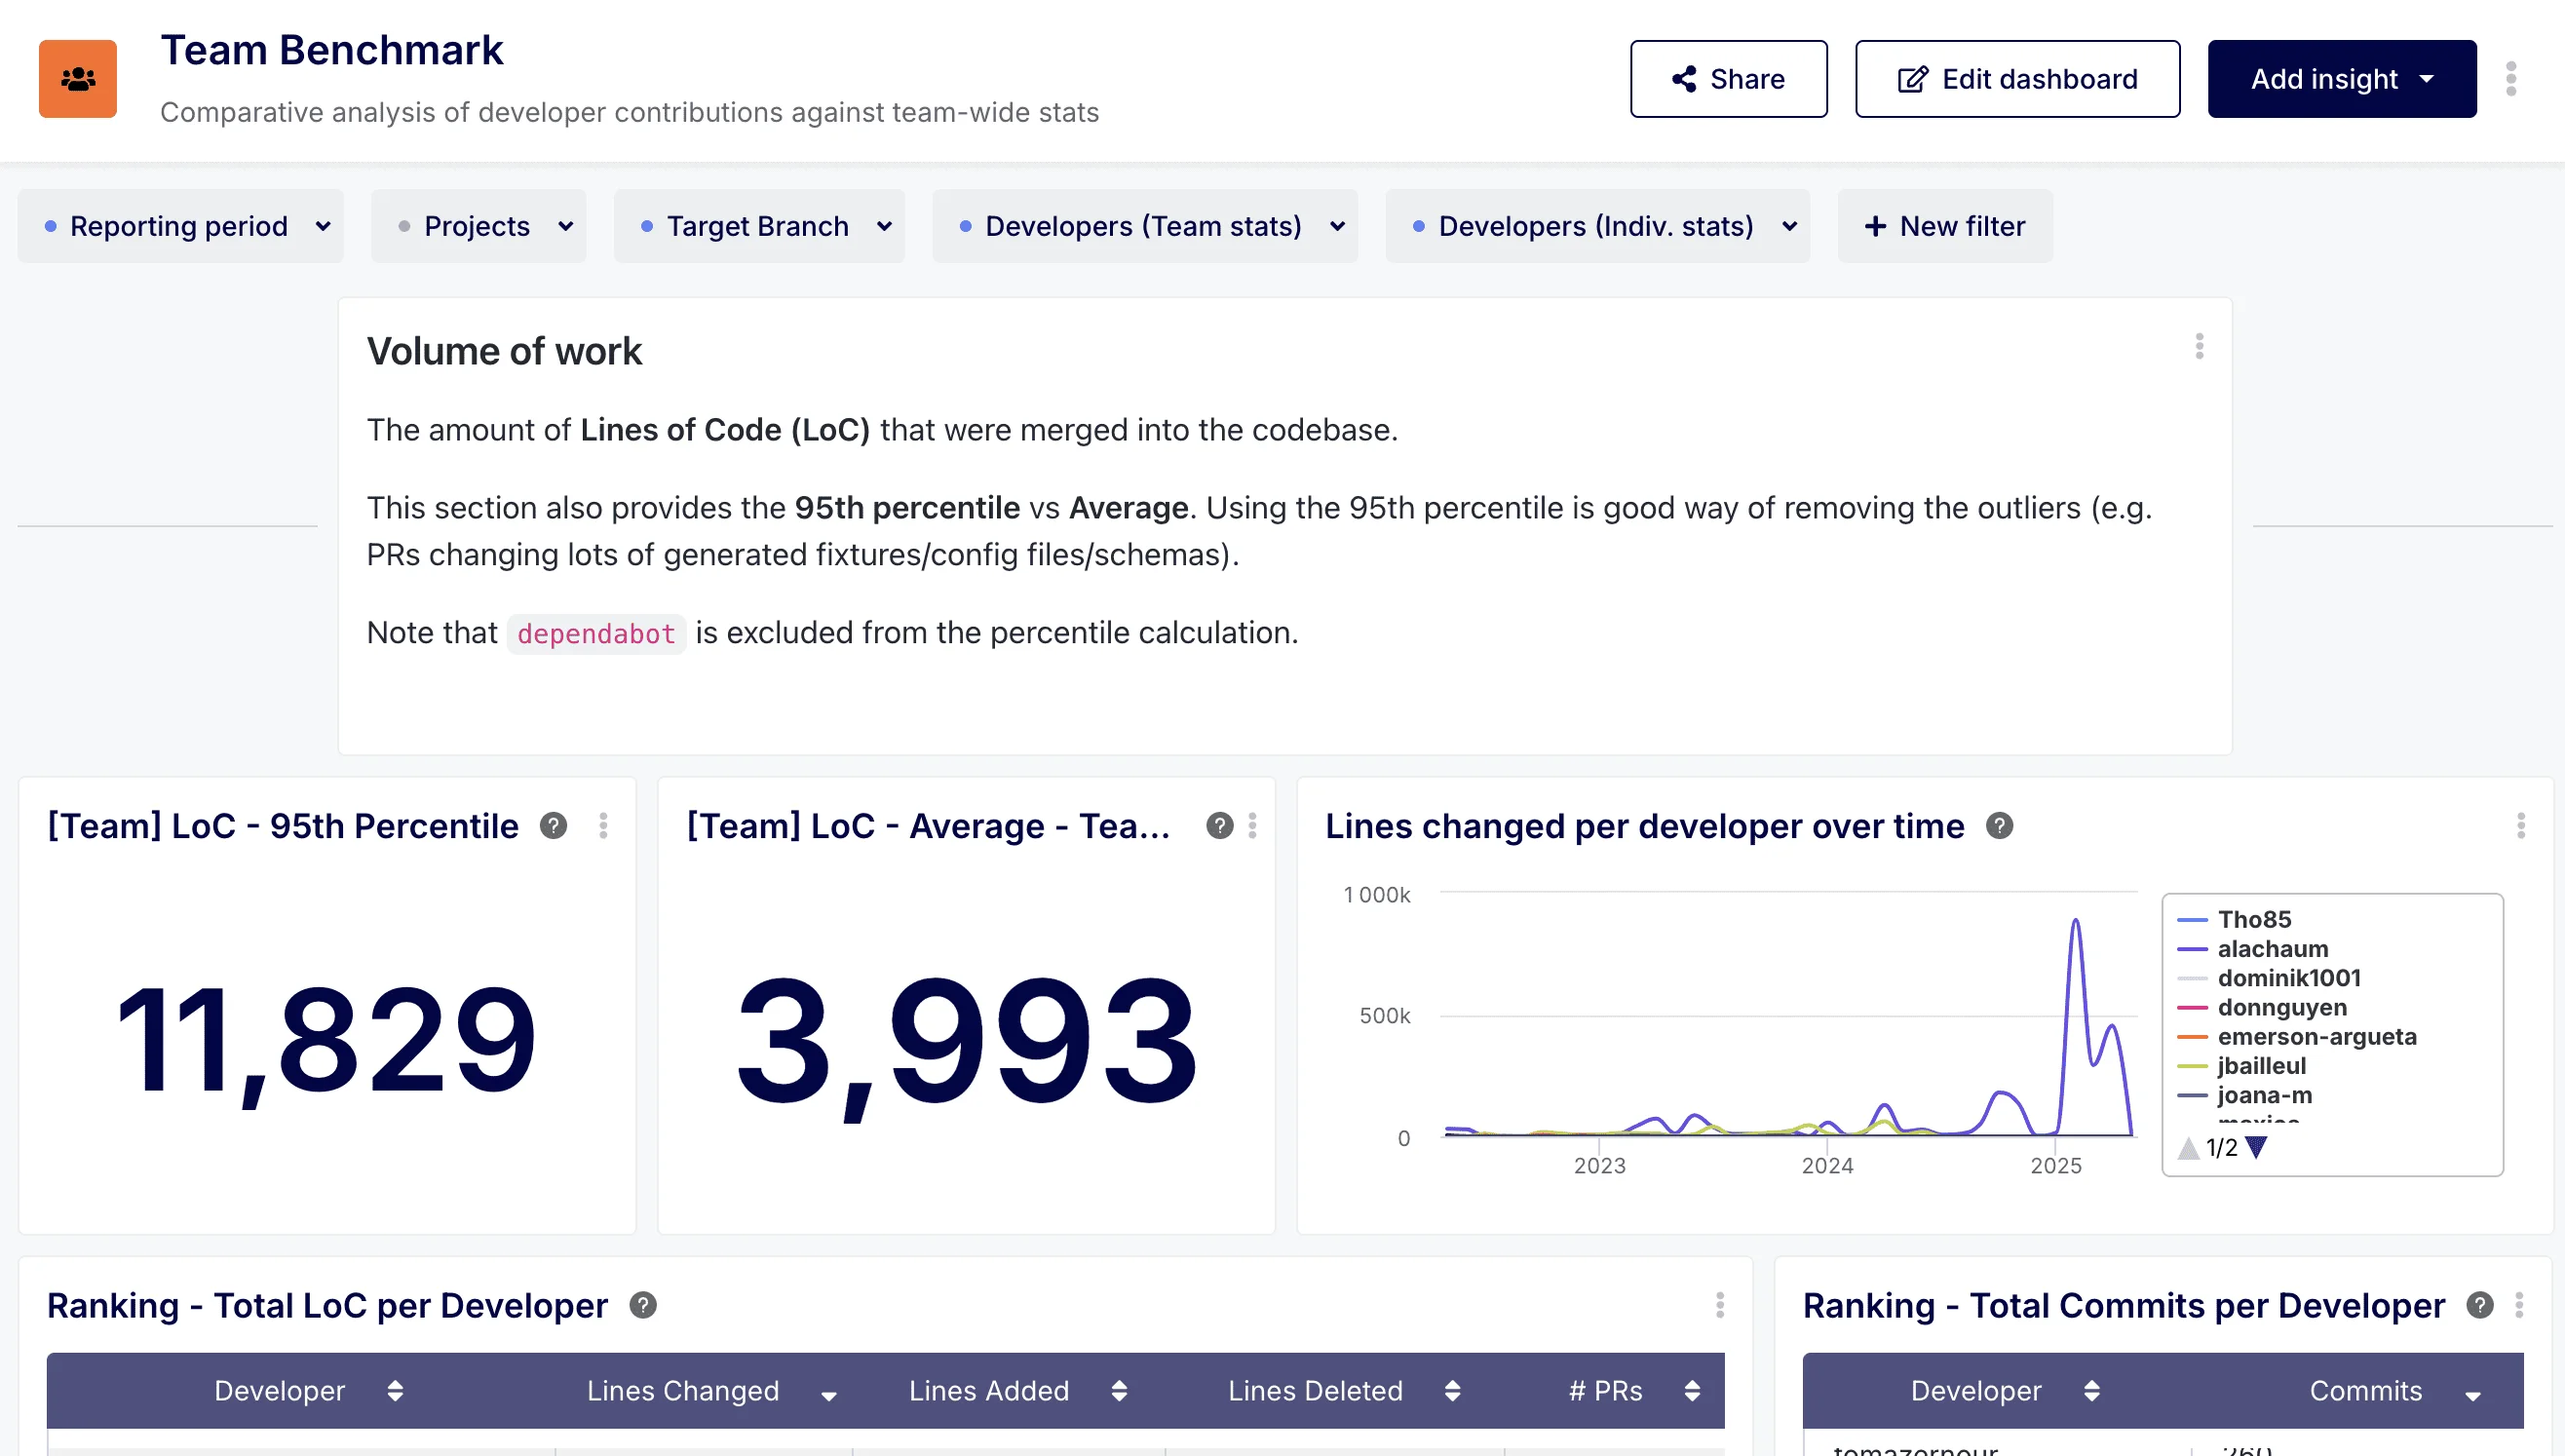
This dashboard's primary objective is to provide a clear, comparative view of individual developer contributions alongside aggregated team-wide statistics. By juxtaposing individual metrics against team benchmarks, it moves beyond isolated data points, offering rich context to better understand performance, workload distribution, and collaborative patterns.
The Team Benchmark dashboard empowers you to identify key trends, pinpoint potential workflow bottlenecks, and foster more productive, data-informed discussions. Dive into detailed breakdowns of Pull Request (PR) cycle times — from coding and idle periods through to review and merge phases — to see where time is truly spent, both for individuals and the team as a whole.
You can also explore metrics around the volume of work, such as Lines of Code (LoC) in PRs (compared against team averages and percentiles), and understand the review load generated and handled within the team.
Ultimately, this powerful tool is designed to help you and your team highlight areas for process optimization, ensure fairer comparisons, and collaboratively enhance overall efficiency and throughput.
Discover now how these comparative insights can drive continuous improvement and a deeper understanding of your software delivery lifecycle.