The DORA Metrics Dashboard
for High-Performing Teams
Stop guessing. Start knowing. Keypup gives you a live, automated DORA metrics dashboard to help you ship faster, reduce failures, and build an elite engineering culture.
✔ No Credit Card required
✔ 14-day obligation-free Trial
✔ Your first insights in minutes
✔ SOC 2 Type II & ISO 27001 certified
Trusted by 8,000+ companies Worldwide, including:
.webp)


.webp)


%20(1).webp)


.webp)
%20logo.webp)
“Keypup allowed us to extract a lot of information from Github that would not be easily accessible otherwise. The support has been great, and the ability to get on a call and go through dashboards I've built has been very helpful in unlocking new possibilities to use the product. We now see what our engagement looks like between members and non-members, allowing us to better understand and interact with our community.”

“We increased our YoY productivity by 45% and Keypup helped us identify our pain points and change the game faster. Their support is the best – they helped us understand which metrics would suit our needs, built dashboards for us, and explained them in detail to us. With Keypup I can now say that we really manage our Engineering teams.”

“I was genuinely impressed with Keypup, not only because of the ease and speed of integration with our tools but also because it provided immediate access to DORA and other key customizable metrics. The standout was the customer support — they swiftly provided a personalized dashboard that enabled me to comprehend and compute real-time metrics with remarkable ease.”

“Keypup is a highly useful and practical platform, boasting user-friendly features and lightning-fast report generation.
The service provided by customer support was excellent, showcasing their dedication to customer satisfaction. We are delighted to be part of the Keypup community.”

“Keypup offers a transparent perspective on our team's functioning and forward movement, streamlining our monitoring of project and pull request cycle times. Their exceptional support also deserves mention; our engagement with Keypup has been positive throughout.”

“Keypup has been instrumental in helping us gain a better perspective on our engineering activities and identifying bottlenecks. Its ease of use combined with its comprehensive features made a difference for us”

“Great product with great support!
Keypup is extremely flexible in its reporting. Once you get your raw data connected, there is almost nothing it can't do. There is a wealth of tables, charts and other reports available. As Director of a software development team, I use Keypup to report on our work efficiencies to senior managment. Keypup makes this task very simple to produce each week.”
No Credit Card Required
Pilot & Accelerate Software Delivery
with Keypup's Automated DORA Metrics Reports
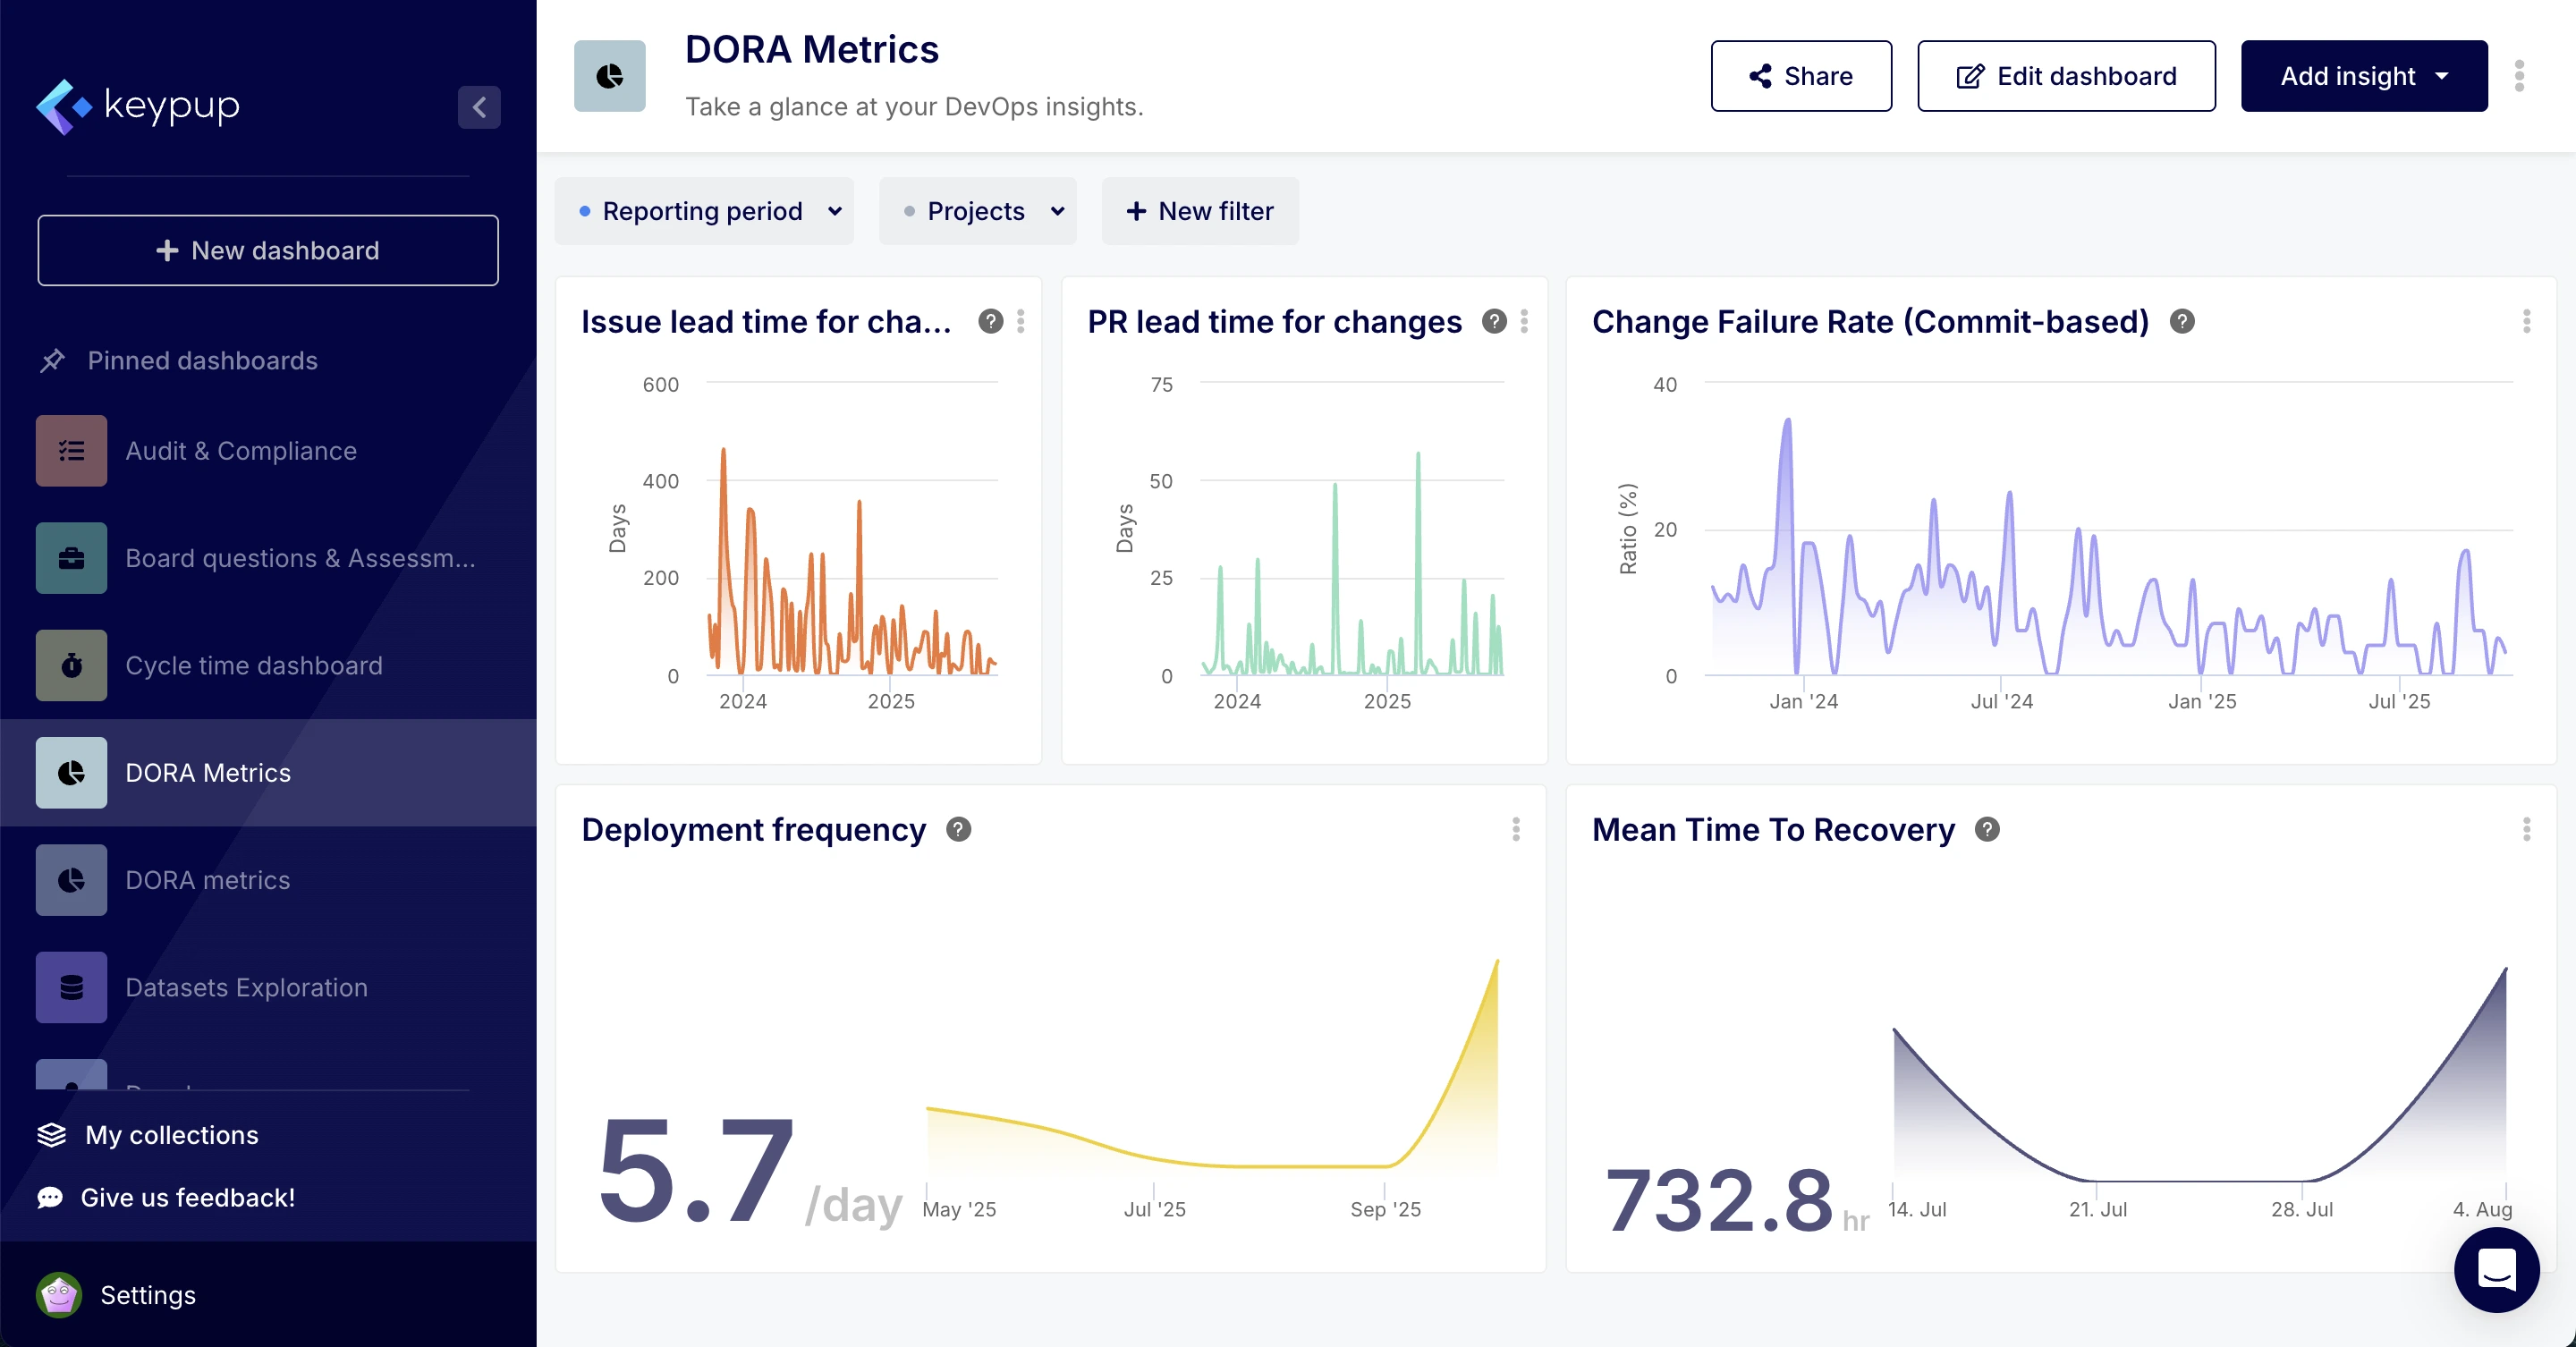
All Four DORA Metrics, Tracked Automatically
Get immediate, real-time visibility into your Deployment Frequency, Lead Time for Changes (Issues and PRs), Change Failure Rate, and Mean Time to Recovery. No more manual calculations.
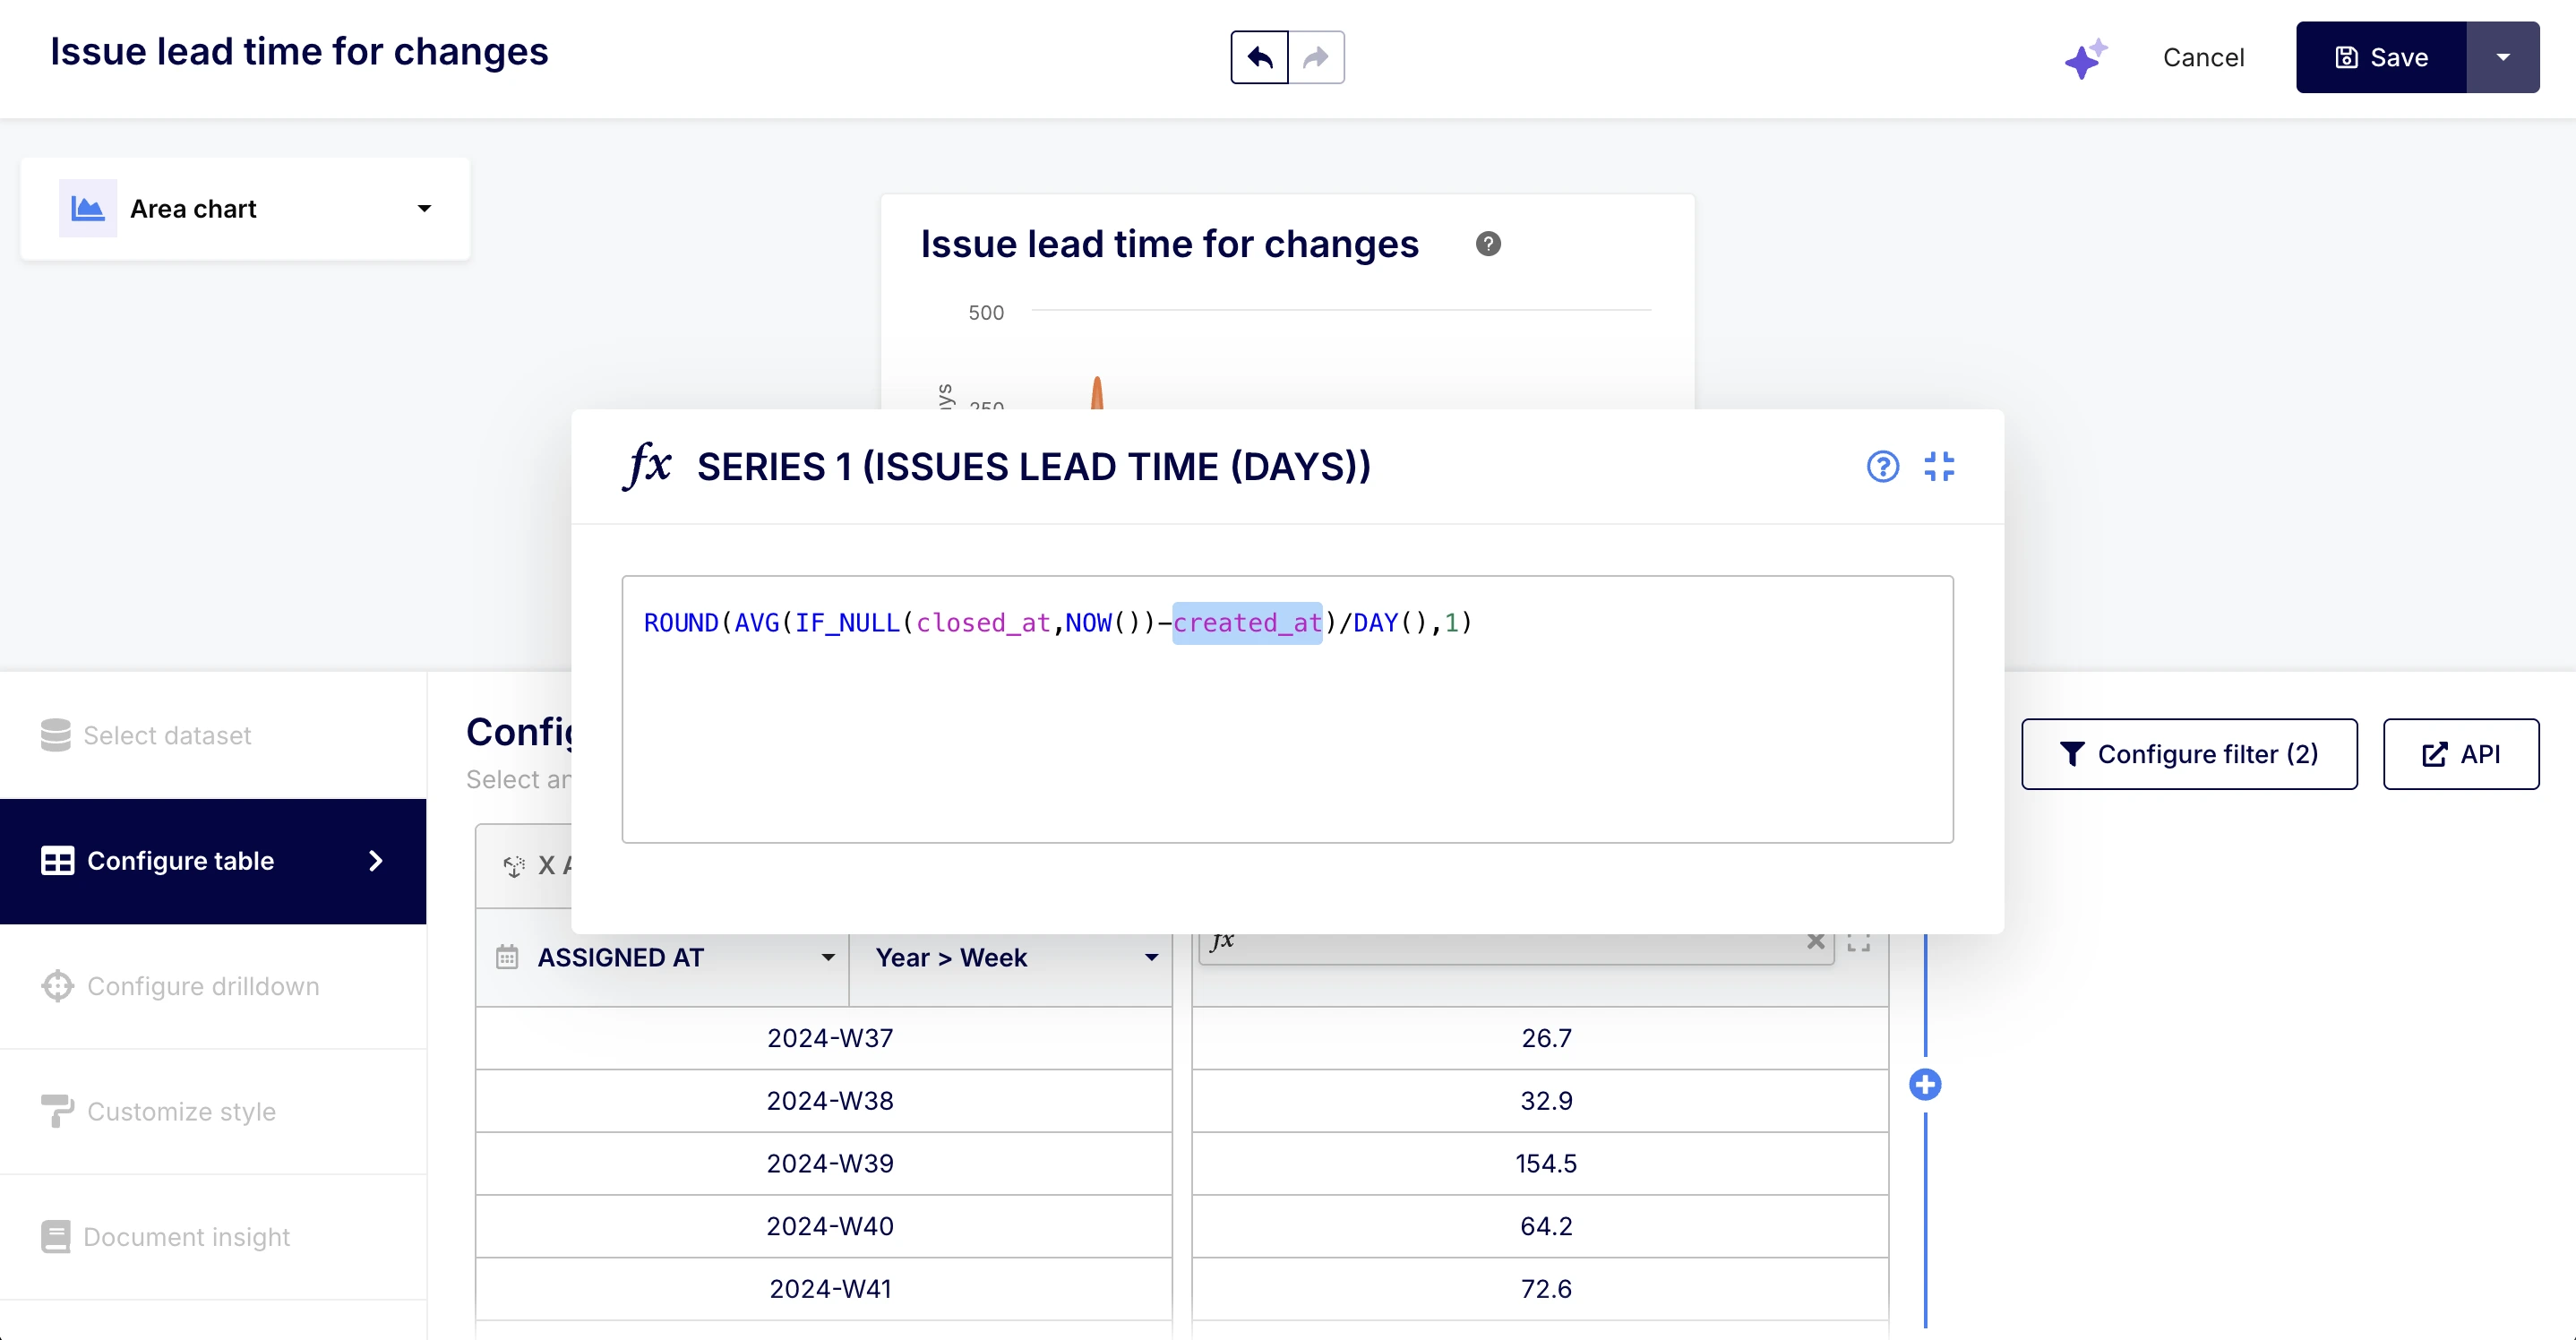
Your Metrics, Your Way
No two teams work alike. Customize your DORA metric calculations to align perfectly with your unique workflow and team objectives, ensuring you focus only on what truly matters.
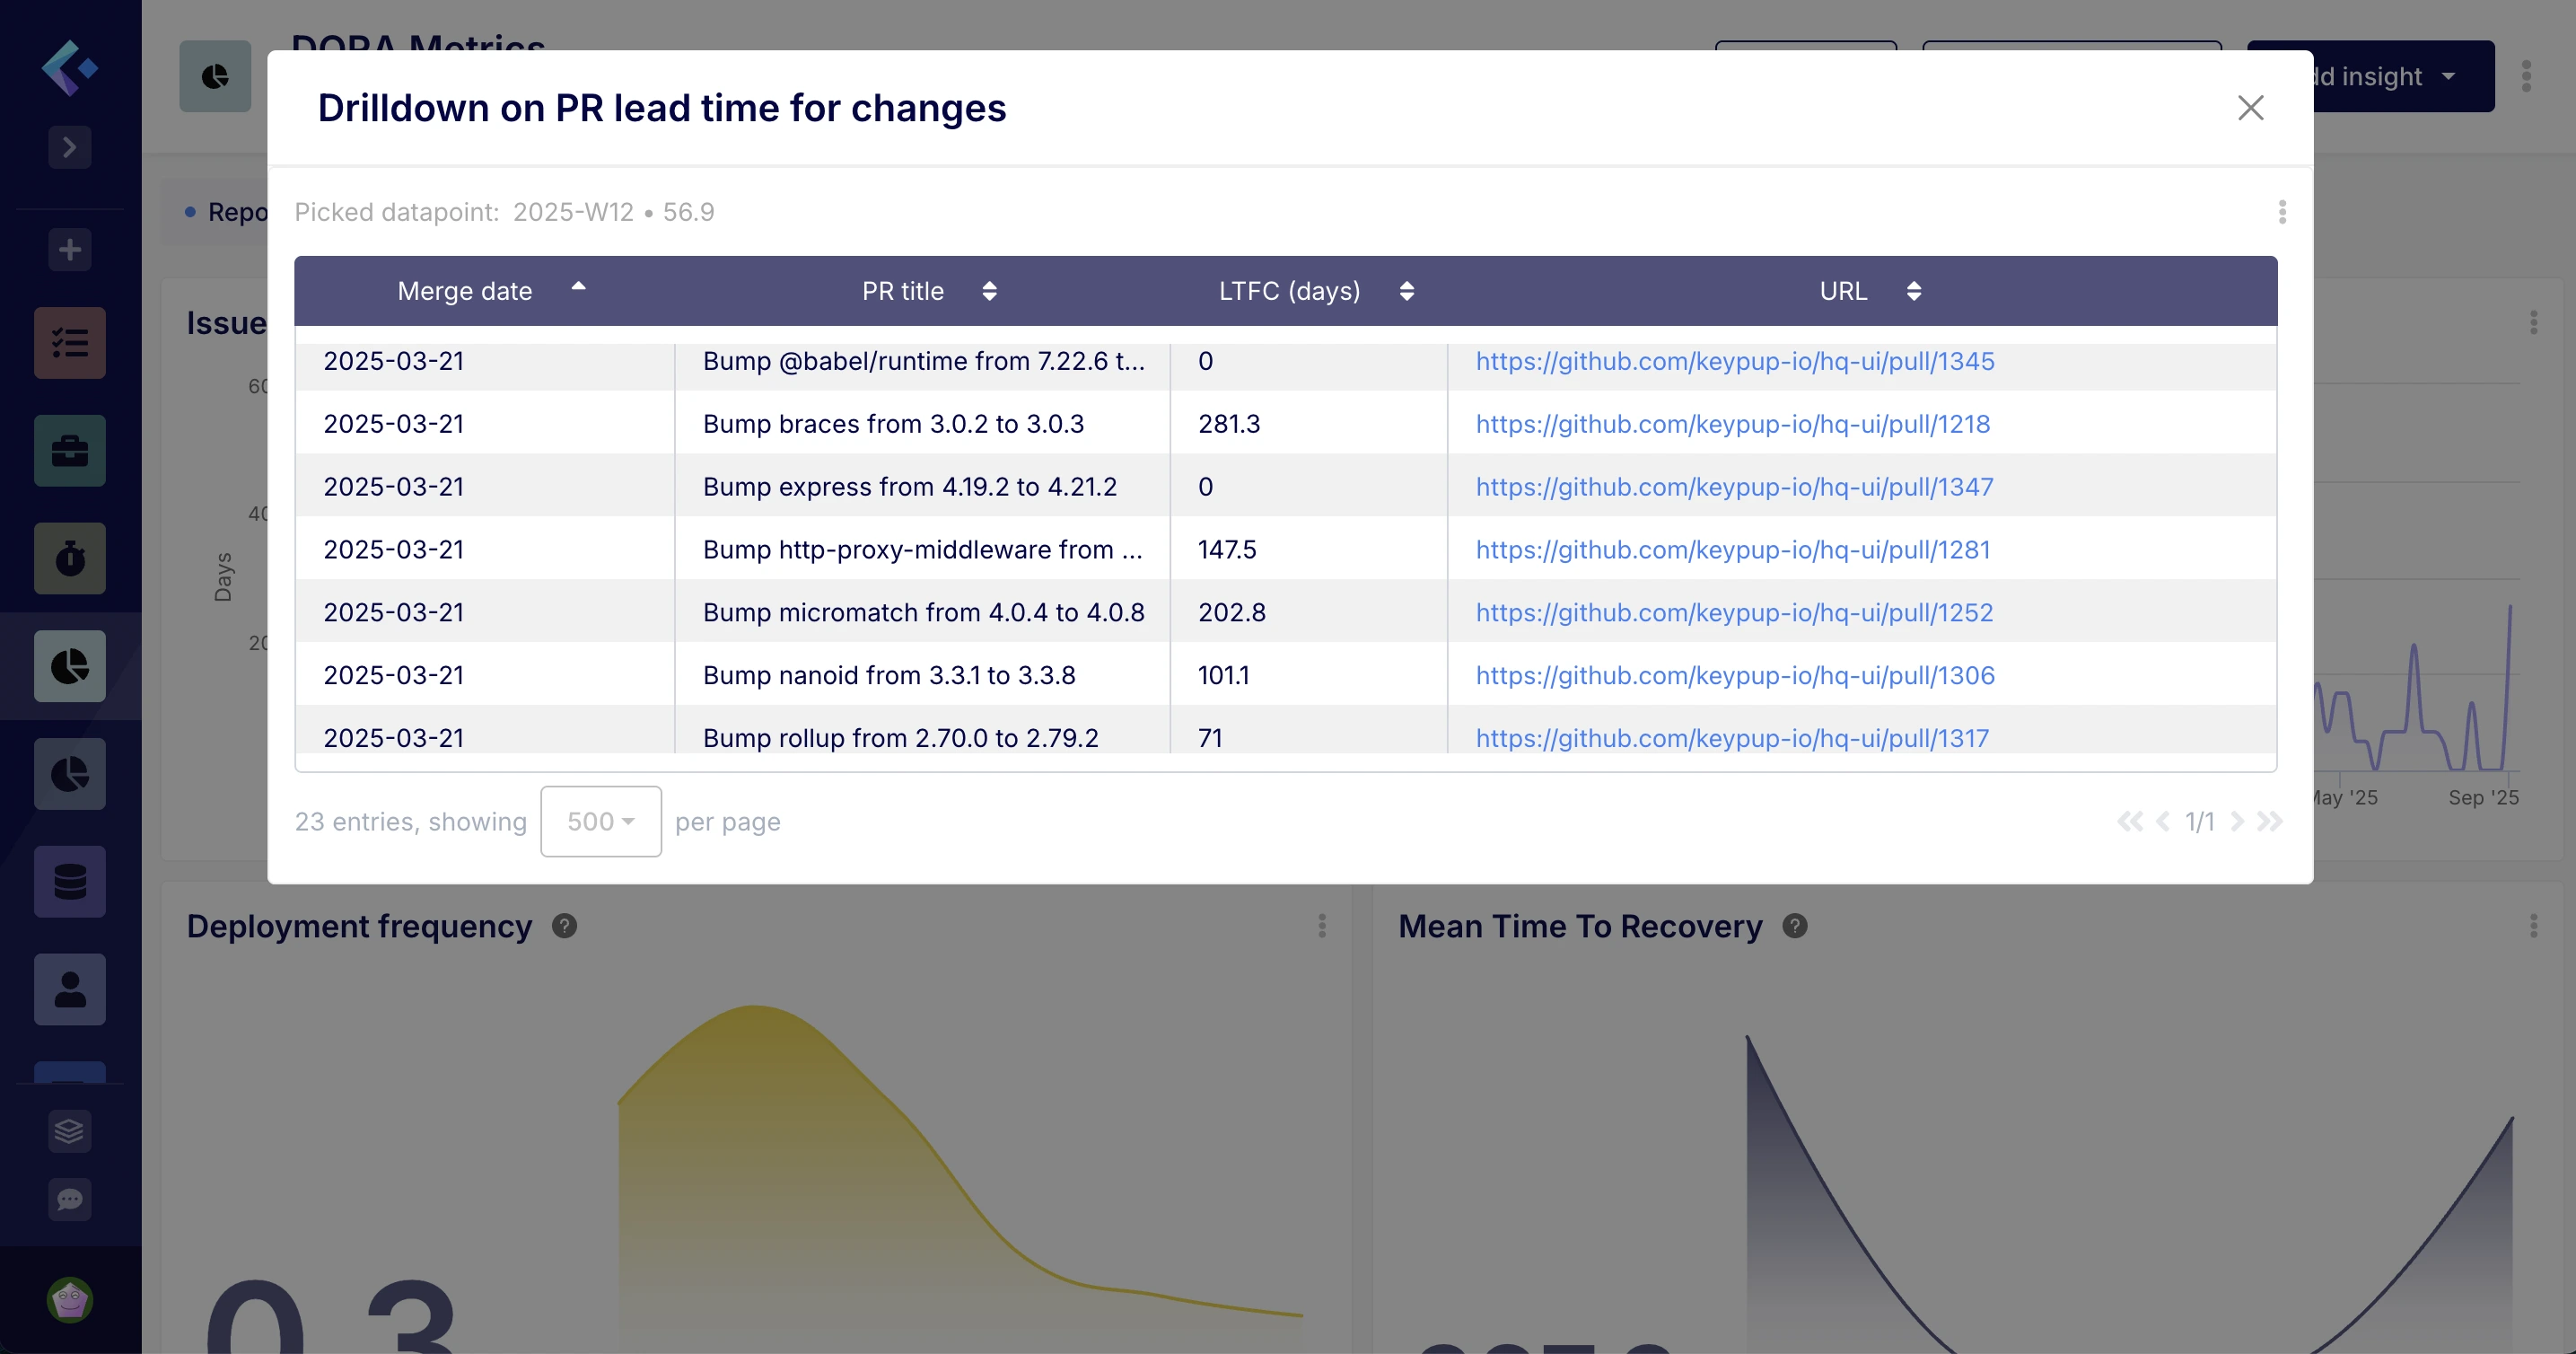
From a Metric to the Root Cause
Our dashboards are fully interactive. See a drop in your Deployment Frequency? Click to drill down and instantly see the pull requests or tickets causing the slowdown.


No Credit Card Required
Frequently asked questions
No Credit Card Required
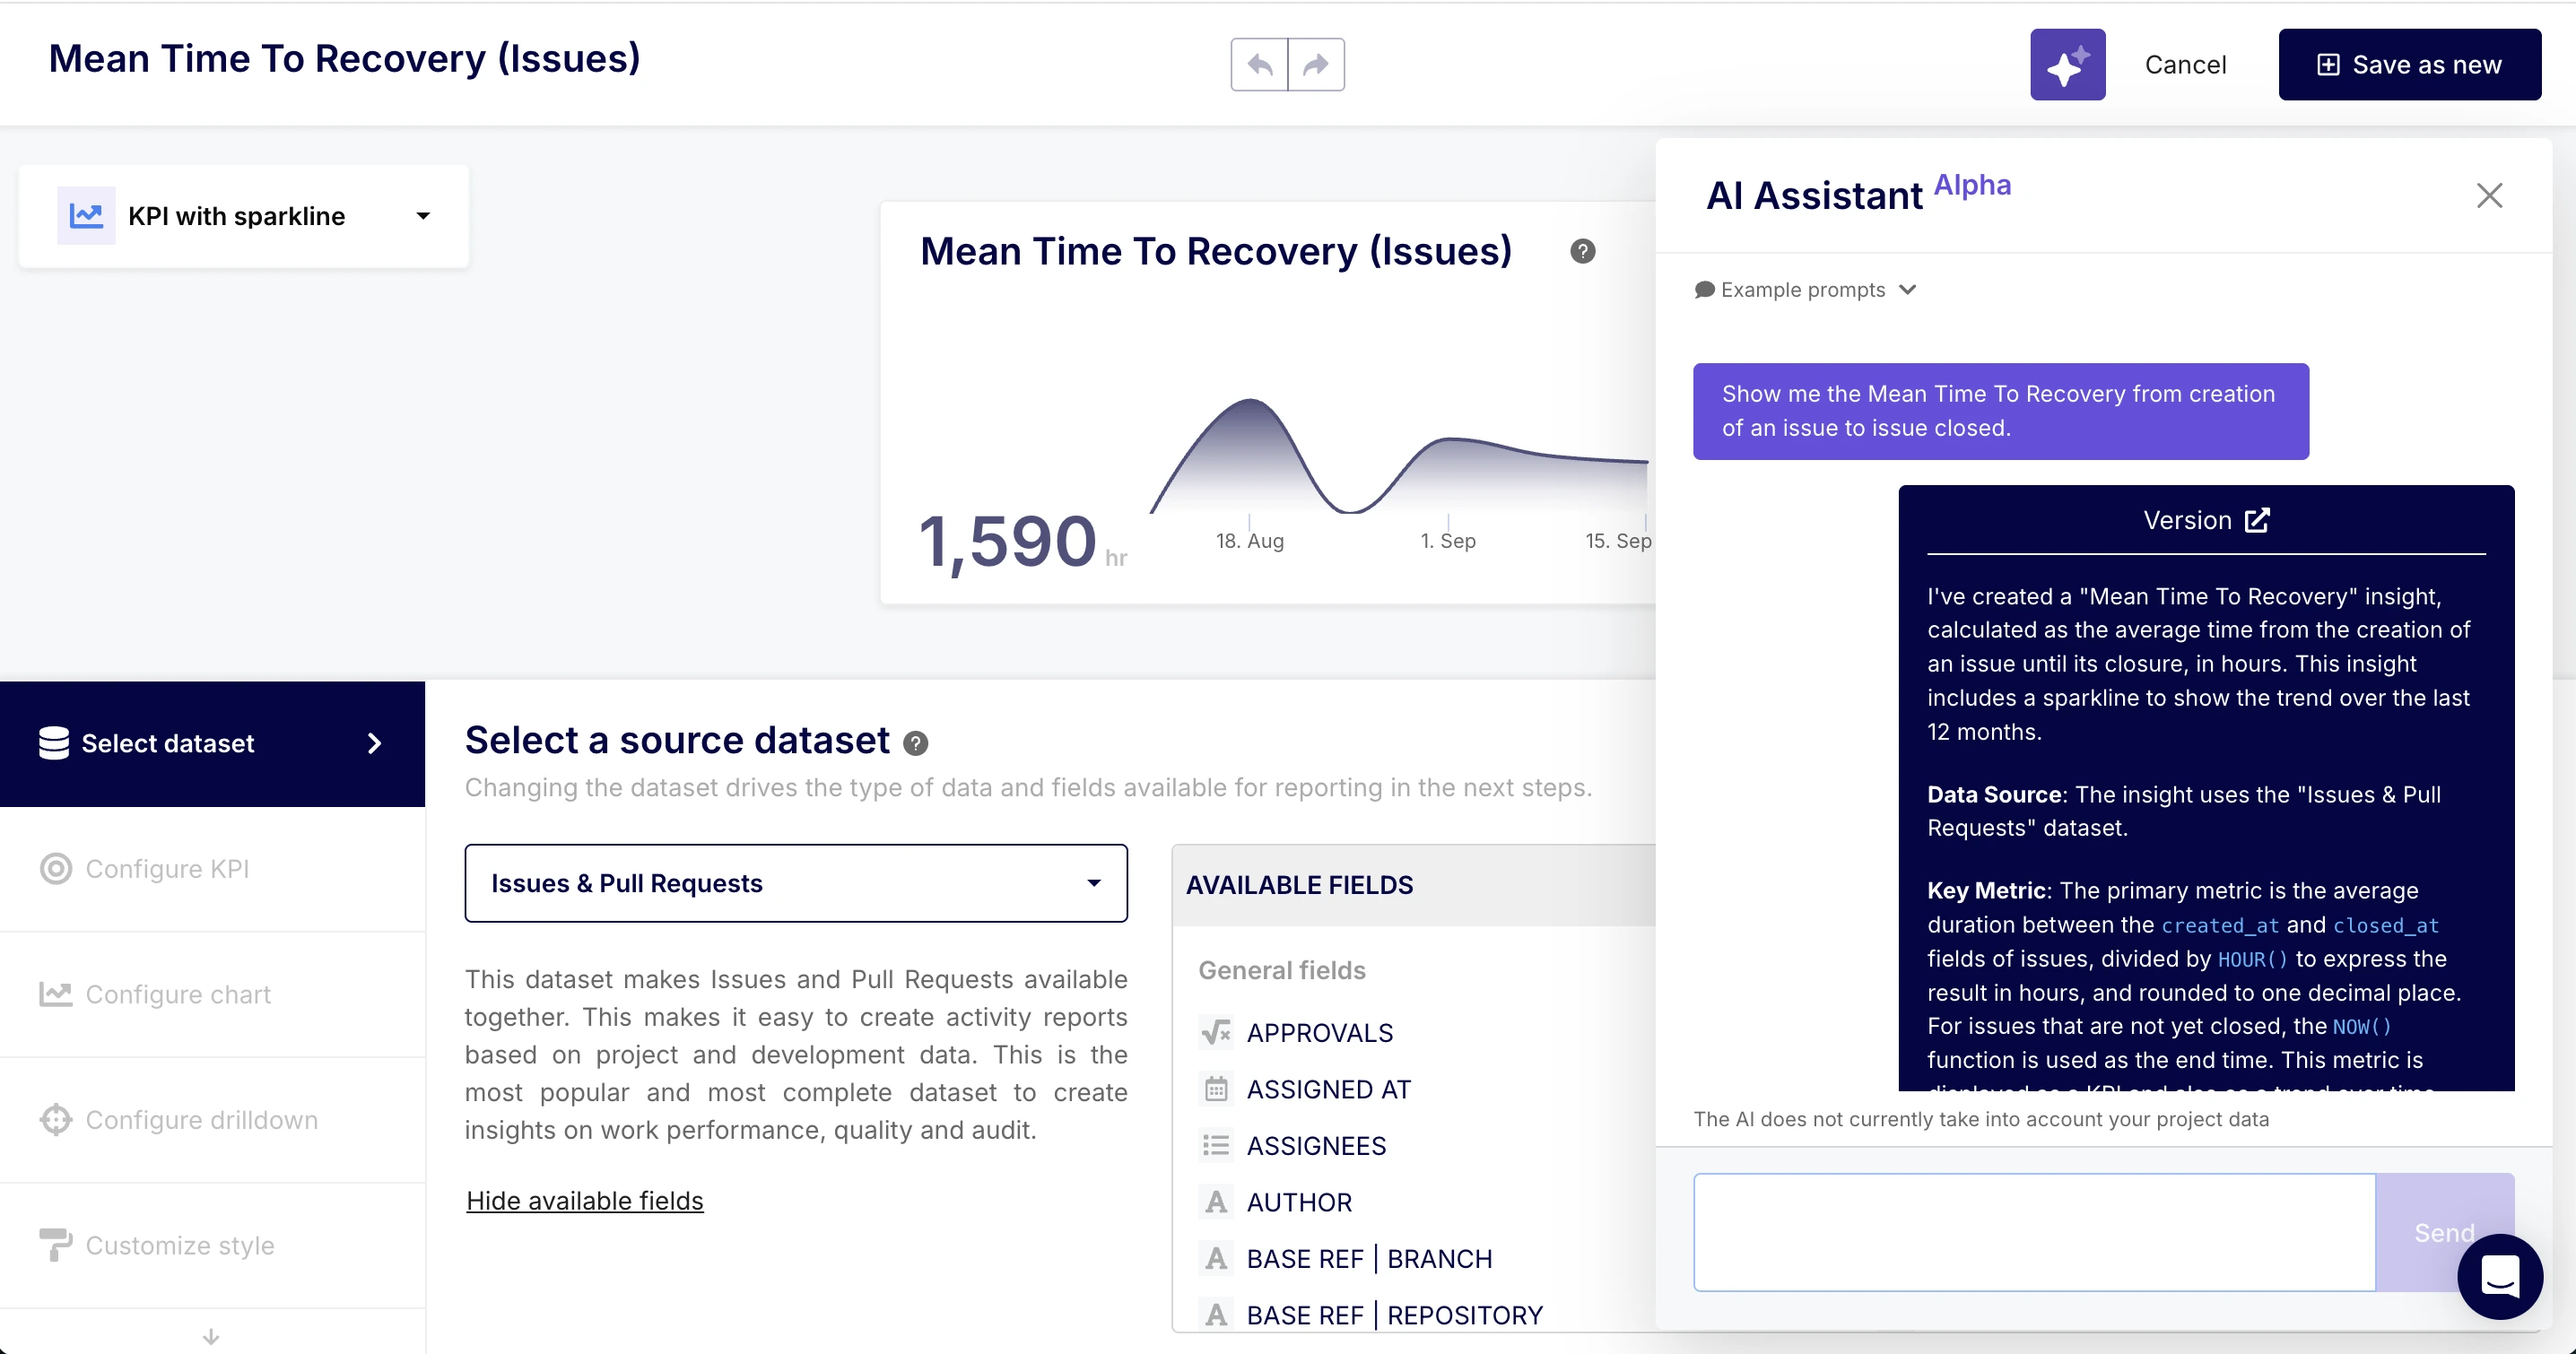
Tired of complicated report builders? With Keypup's AI Assistant, you don't need to be a data expert. Simply ask a question in plain English, like 'show me the average merge time per developer last month,' and our platform instantly builds the chart for you. It's the fastest way to get the exact insights you need
No Credit Card Required

Unify Your Tools, See the Full Picture
Your development data is scattered. Keypup brings it all together. Instantly connect your Git repos, Jira, and other tools to create a single, unified view of your entire development lifecycle.
This isn't just a data dump. It's an intelligent map of your team's performance, ready for analysis in seconds.


From Data to Decisions, Instantly
Stop hunting for insights. Simply ask a question and Keypup instantly builds the perfect chart.
Every visualization is live and interactive. Drill down from a high-level trend to the specific pull request or ticket that needs your attention.
It’s the fastest way to understand performance, collaborate with your team, and share clear insights that drive action.
Drive Continuous Improvement
Start immediately with a library of proven templates for monitoring team performance, delivery efficiency, and code quality.
Use these insights to set data-driven goals, standardize best practices, and coach your teams effectively. Keypup transforms data into a shared language, empowering you to build a true data-driven culture and scale engineering excellence.


Sign-up and accelerate your engineering organization today !
