How Does Your Engineering Team
Really Perform?
Go beyond gut feelings. Use data to benchmark individual and team performance, identify bottlenecks, and build a truly high-performing engineering culture.
.webp)
Join 7,000+ software teams in the Engineering Analytics revolution
From startups to large enterprises, Keypup serves all the unique complexities related to project size, structure and teams, including:
%20logo.webp)


%20(1).webp)


.webp)


.webp)


.webp)


.webp)


“Keypup is a highly useful and practical platform, boasting user-friendly features and lightning-fast report generation.
The service provided by customer support was excellent, showcasing their dedication to customer satisfaction. We are delighted to be part of the Keypup community.”


“Keypup has been instrumental in helping us gain a better perspective on our engineering activities and identifying bottlenecks. Its ease of use combined with its comprehensive features made a difference for us”

“Great product with great support!
Keypup is extremely flexible in its reporting. Once you get your raw data connected, there is almost nothing it can't do. There is a wealth of tables, charts and other reports available. As Director of a software development team, I use Keypup to report on our work efficiencies to senior managment. Keypup makes this task very simple to produce each week.”
Benchmark Performance Fairly
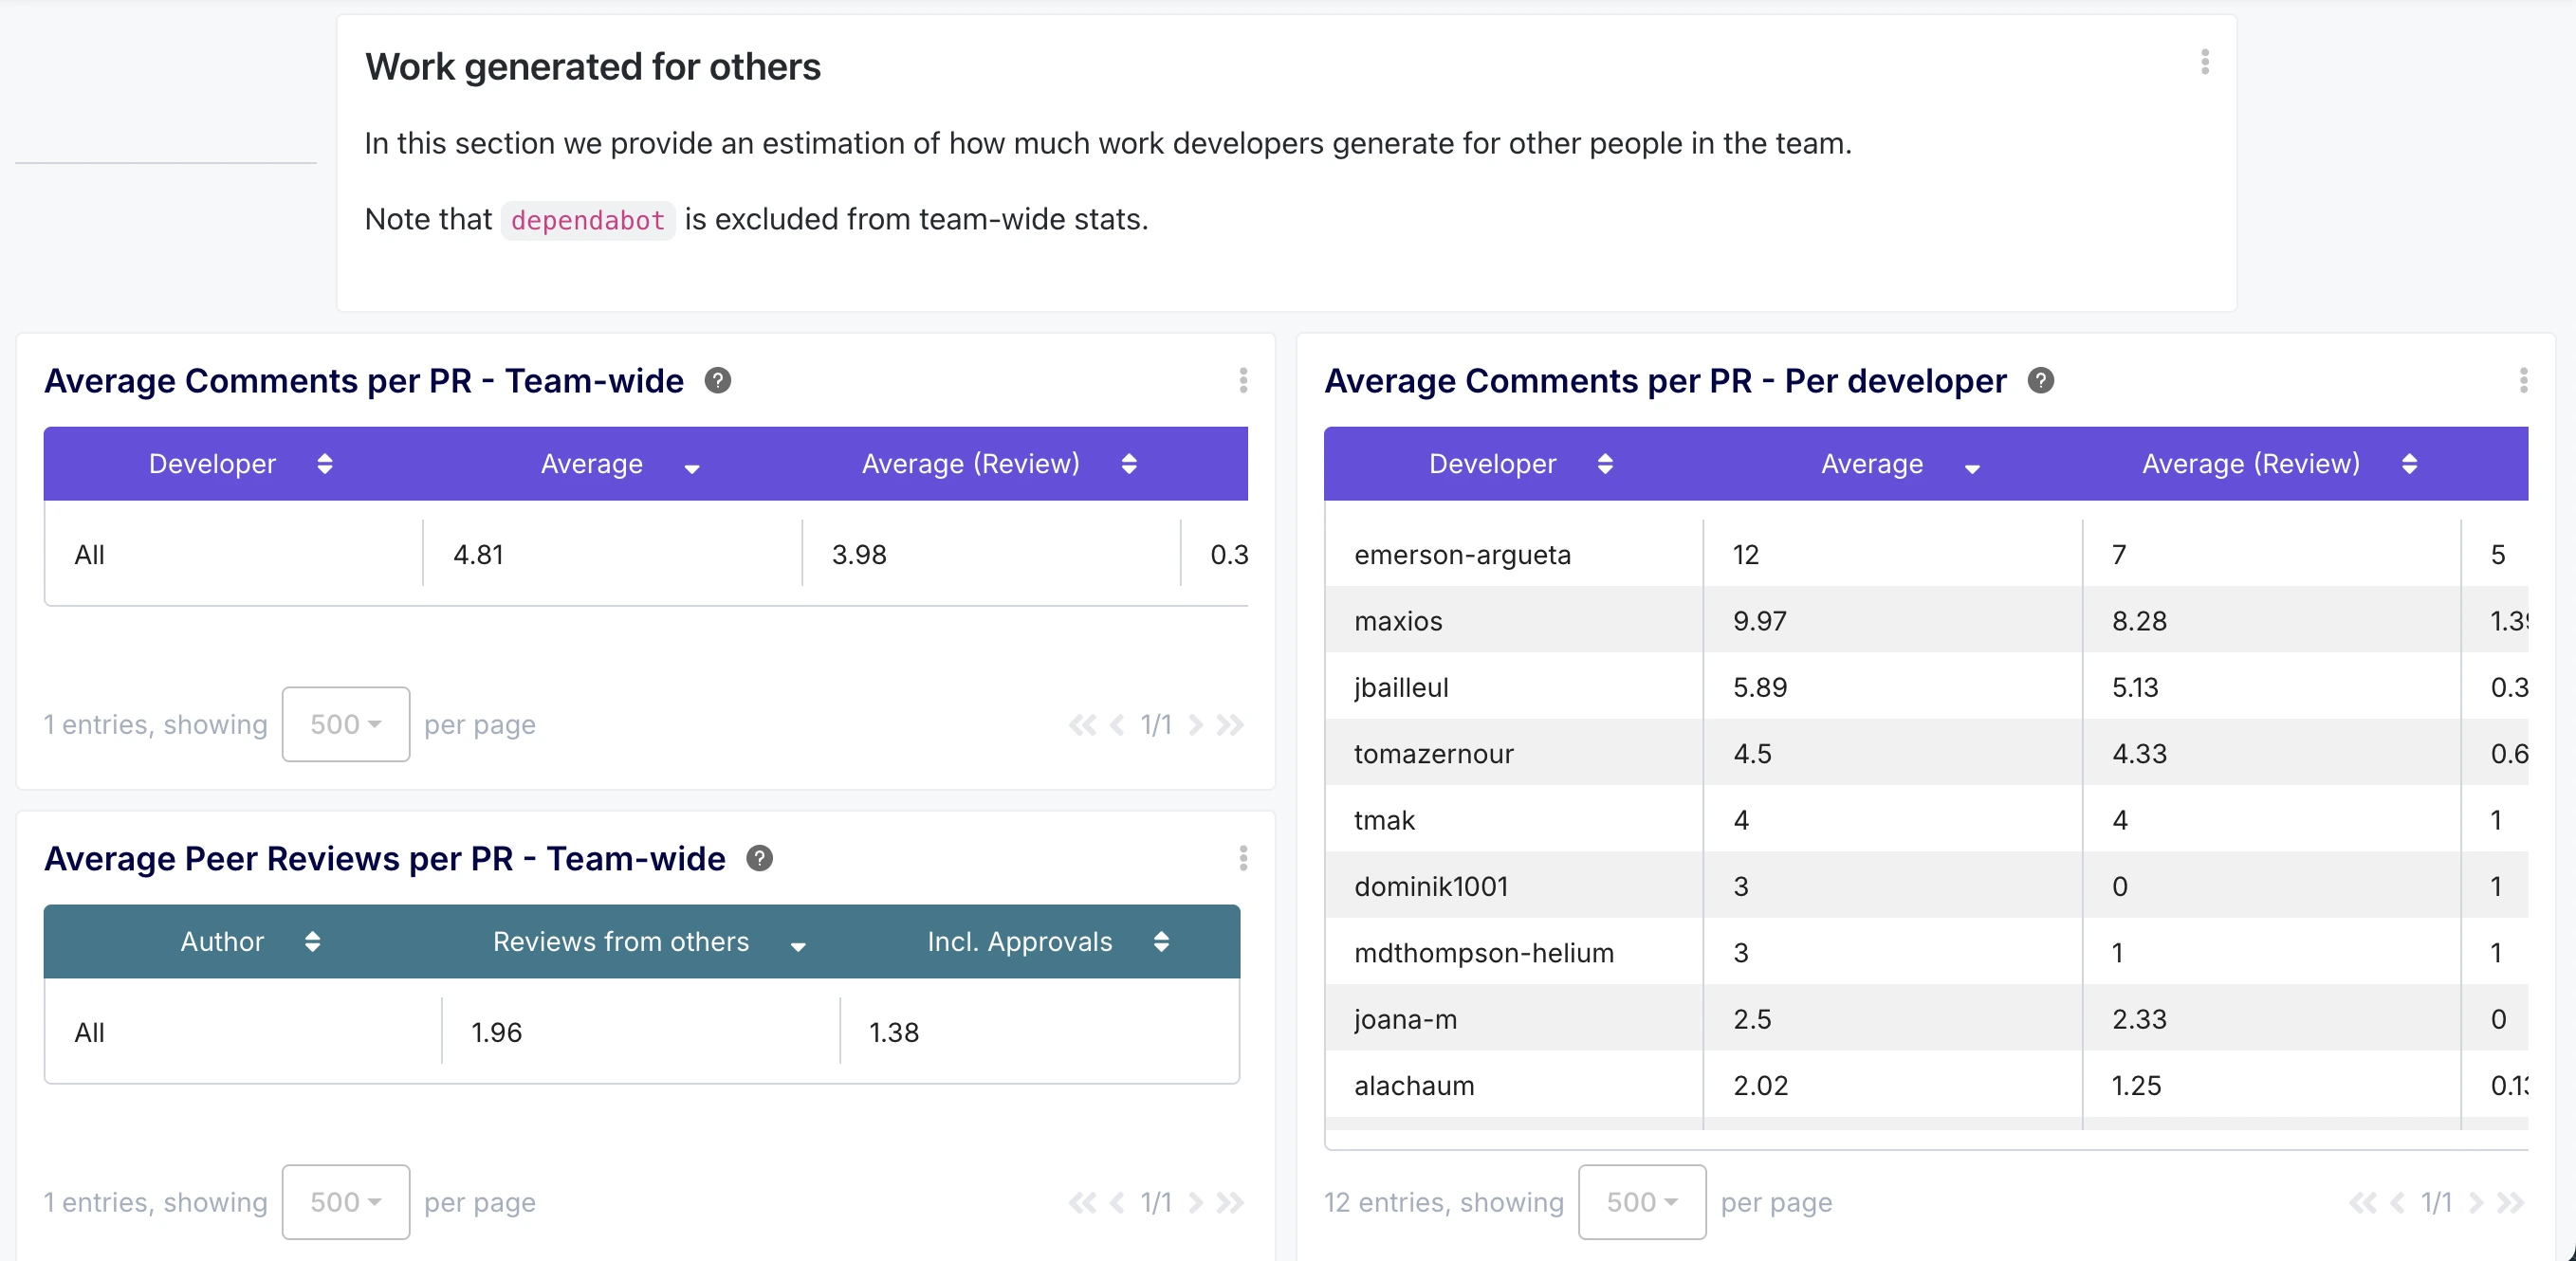
Pinpoint Bottlenecks and Understand Individual Outputs
Why Gut Feel Isn't Enough
You know who your top performers are, but can you prove it with data? Can you spot who is struggling before they burn out? Effective team management requires objective, comparative data to make fair assessments, identify coaching opportunities, and understand your team's real capacity.
.webp)
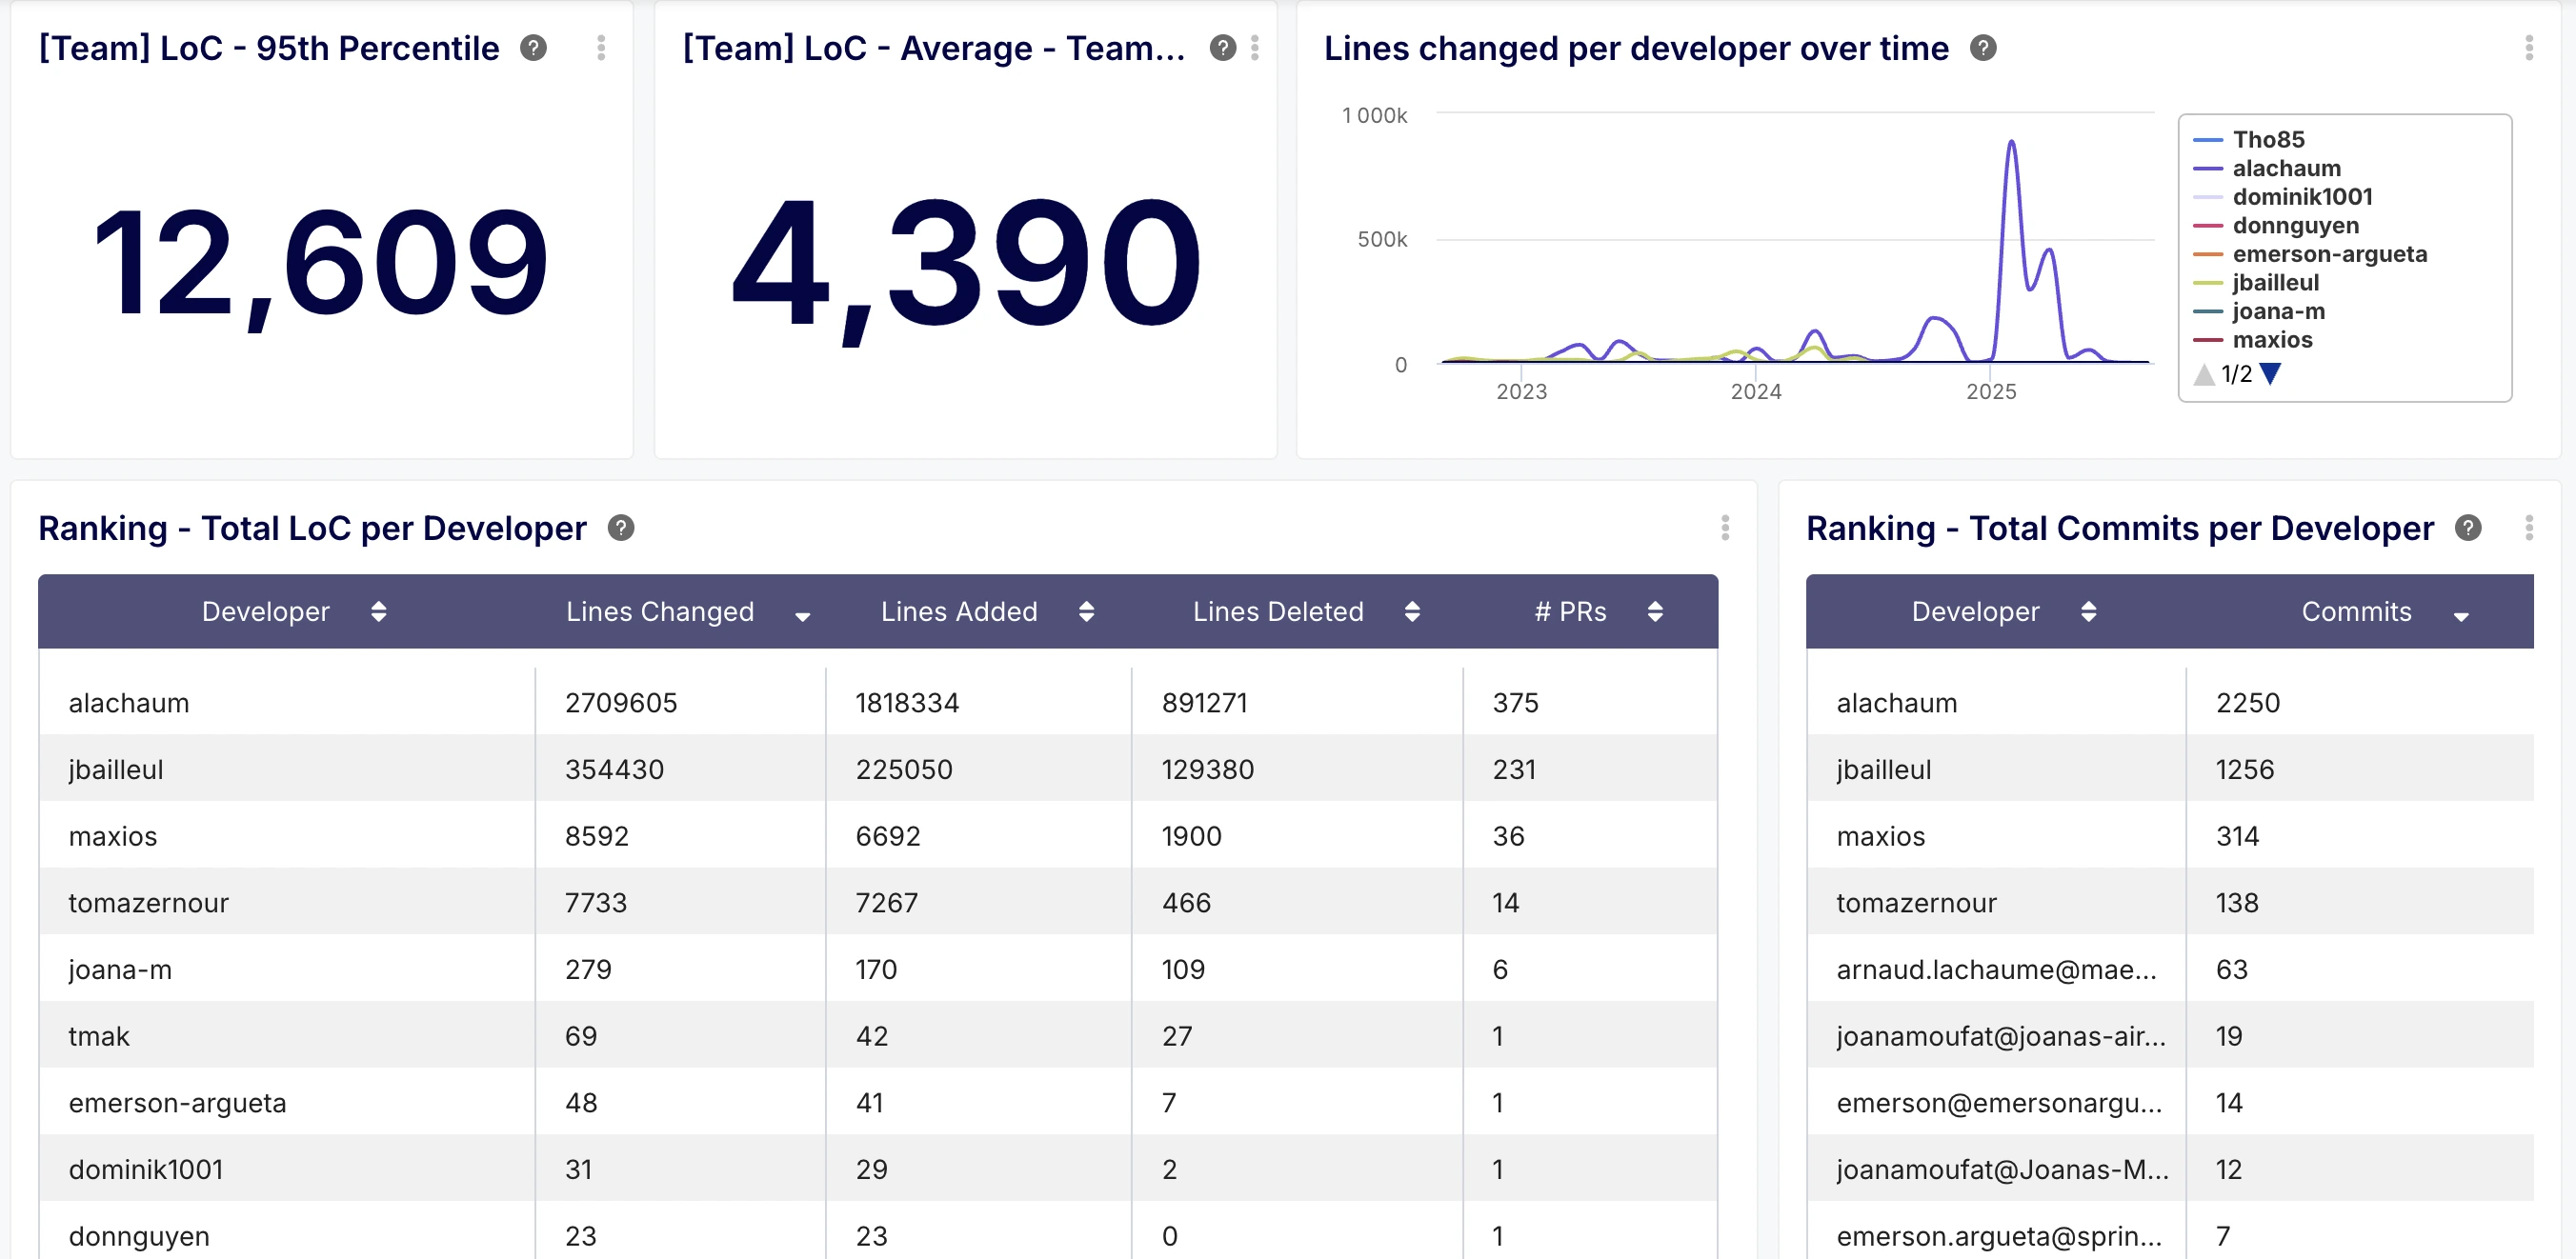
The Key Metrics to Benchmark
A successful benchmark compares developers against the team average across several key areas.
You need to look at Cycle Time to understand speed, Code Volume (Commits, LoC) to see output, and Review Metrics (Idle Time, Review Time) to assess collaboration and identify bottlenecks.
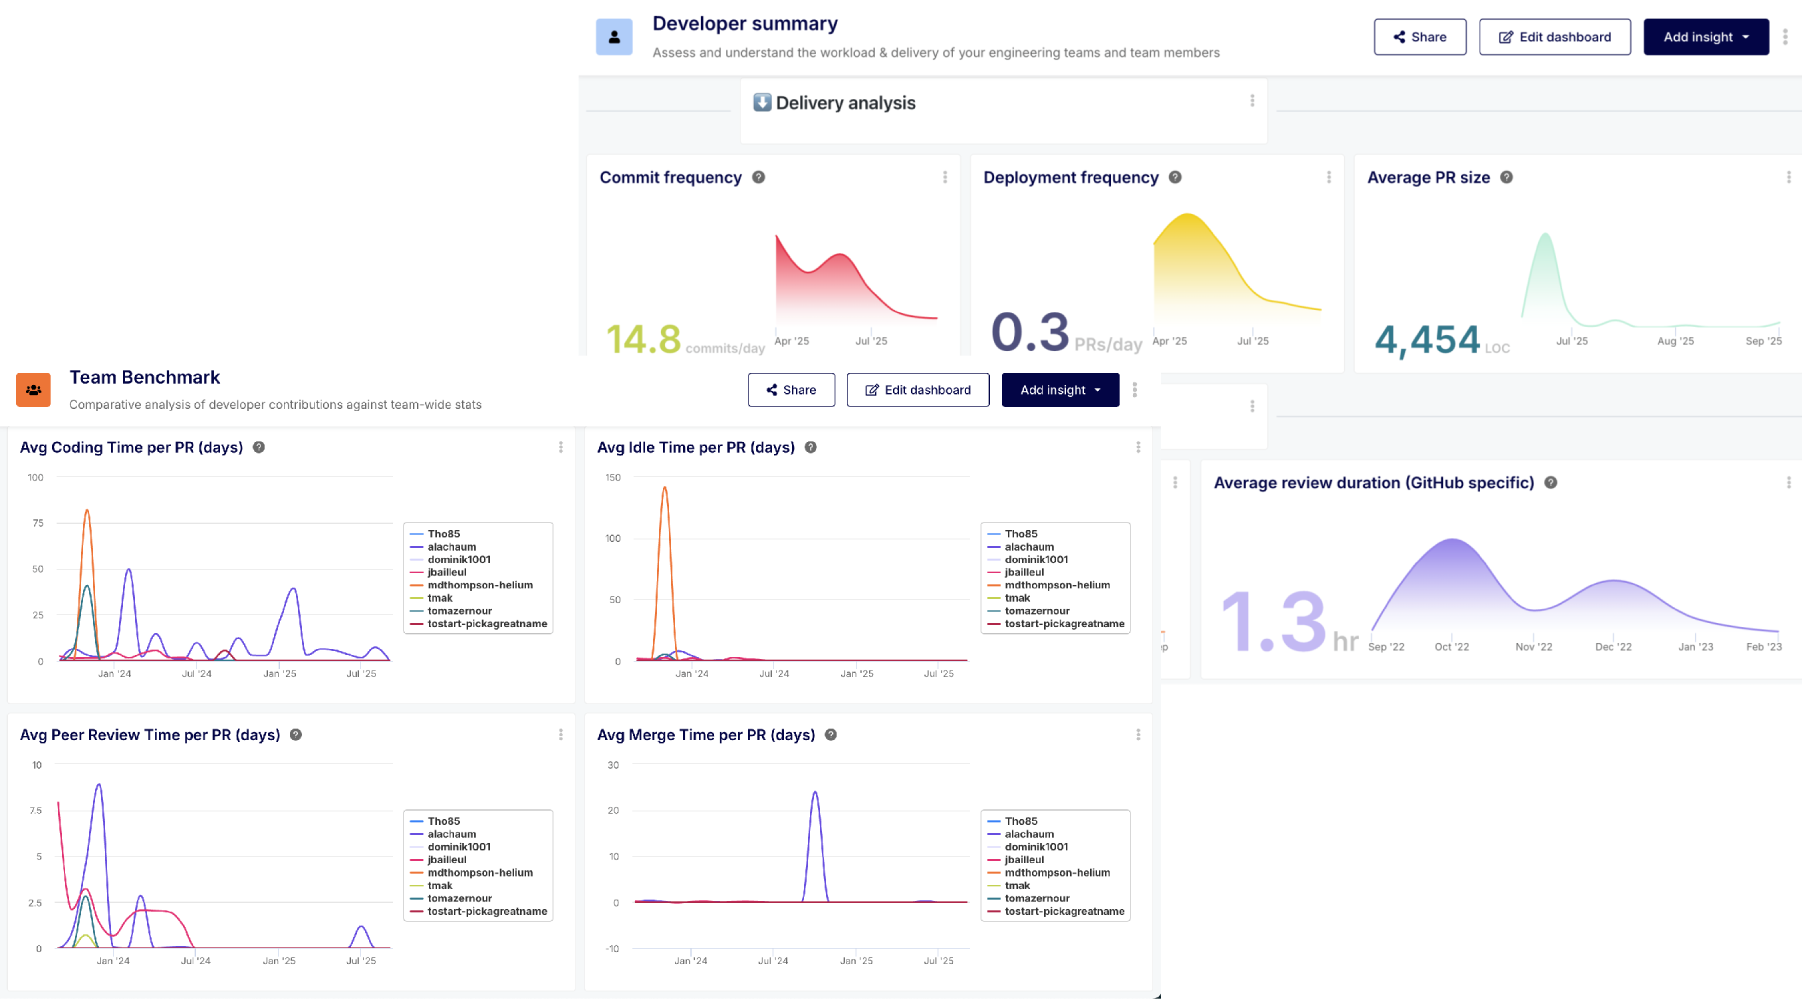
The Easiest Way to Benchmark Performance
Keypup's Team Benchmark dashboard does the hard work for you. We connect to your Git repos and automatically calculate and visualize every key metric, showing individual performance against team averages in one clear, interactive view. Stop building spreadsheets and start having data-driven conversations.


Turn Your Own Words into Powerful Insights in One Click
Our AI Assistant builds reports for you instantly.
Go Beyond Git Analytics

Connect and Explore
Connect to your git repo(s) and ticketing/project management platform(s) and transform your software development meta-data silos into a unified, detailed, and solution-centric ecosystem with Keypup's Canonical Data Model (CDM).
Leverage Keypup’s AI assistant to automatically extract decision-enabling visualizations, highlight roadblocks, and power efficiency.


Visualize and Analyze
Turn raw data into meaningful narratives, effortlessly. With Keypup's AI Assistant, you no longer need to hunt for insights. Just ask a question, and our AI instantly creates the perfect visualization, tailored to your request.
Every chart is live and interactive, with an automated drill-down feature that lets you zoom from a high-level trend to a specific data point in a single click.
It's the most intuitive way to analyze your data, collaborate on documented views, and share decisive information with your organization.
Improve and Scale
Build a software development data ecosystem that seamlessly ties in with the future of your organization.
Keypup's ready-to-use templates can help monitor key aspects, such as your team’s performance, development efficiency, quality and delivery, resource planning, processes, and more. A shift in mindset can enable you to become a data-first engineering organization and drive company growth.


Sign-up and accelerate your engineering organization today !
